| Characteristic | All Speakers1 | Control1 | People with Parkinson’s Disease (PwPD)1 |
|---|---|---|---|
| Sex | |||
| Female | 16 (47%) | 12 (57%) | 4 (31%) |
| Male | 18 (53%) | 9 (43%) | 9 (69%) |
| Age | 66.88 (10.99) | 64.33 (10.81) | 71.00 (10.38) |
| Time Since Diagnosis (years) | - | - | 6.62 (4.48) |
| Severity2 | |||
| Mild | - | - | 3 (23%) |
| Moderate | - | - | 5 (38%) |
| Severe | - | - | 3 (23%) |
| Profound | - | - | 2 (15%) |
| 1 n (%); Mean (SD) | |||
| 2 Severity labels were previously determined by Thompson & Kim (2024) based on the intelligibility measures using the surrogate-severity measures outlined in Stipancic et al. (2022). Specifically, intelligibility values > 94% are ‘Normal’, 85% - 94% are ‘Mild’, 70% - 84% are ‘Moderate’, 45% - 69% are ‘Severe’, and < 45% are ‘Profound’. | |||
This is a pre-print and has not been peer-reviewed.
Disclosures:
This study was supported by two NIDCD grants: an F31 awarded to A. Thompson (NIH DC020121) and an R01 awarded to Y-J. Kim (NIH DC020468). The Korea Health Industry Development Institute (KHIDI) grant awarded to Y-J. Kim also partly supported the study (HI22 C0736). The authors have no other relevant financial or non-financial information to disclose.
Corresponding Author:
Austin Thompson, PhD, CCC-SLP
athomp27@central.uh.edu
Authorship Contributions (CRediT taxonomy - https://casrai.org/credit/)
Author Roles: 1conceptualization, 2data curation, 3formal analysis, 4funding acquisition, 5investigation, 6methodology, 7project administration, 8resources, 9software, 10supervision, 11validation, 12visualization, 13writing – original draft, 14writing – reviewing & editing
AT: 1, 2, 3, 4, 5, 6, 9, 11, 12, 14
MH: 3, 5, 6, 7, 9, 11, 12, 13, 14
YK: 1, 2, 4, 5, 6, 7, 8, 9, 10, 11, 12, 14
Ethical Approval: This study was approved by the Florida State University’s Institutional Review Board (FSU IRB: 00002525).
Keywords: Dysarthria; Acoustics; electromagnetic articulography
Abstract
Purpose: This study examined how wearing electromagnetic articulography (EMA) sensors affects acoustic and perceptual speech outcomes in people with Parkinson’s disease (PwPD) with dysarthria and neurologically healthy control speakers. Additionally, the study explored potential after-effects on acoustic and perceptual measures following approximately 45 minutes of wearing EMA sensors in both groups. Finally, we investigated whether wearing EMA sensors or after-sensor effects differentially impacted the two groups.
Methods: Thirty-four speakers (21 Controls and 13 PwPD) read the Caterpillar Passage at three time points: (1) Before Sensors, (2) With Sensors, and (3) After Sensors. We analyzed changes in acoustic (articulation rate, articulatory acoustic vowel space [AAVS], first and second spectral moment coefficients for fricatives) and perceptual (speech intelligibility, naturalness) measures across two key contrasts: sensor effects (With Sensors - Before Sensors) and after-sensor effects (After Sensors - Before Sensors).
Results: Bayesian linear mixed-effects models showed sensor effects, with EMA sensors reducing intelligibility and naturalness and altering fricative spectral moments in both groups. Additionally, Control speakers exhibited a faster articulation rate with sensors. Notably, PwPD were more negatively impacted by sensor effects in terms of intelligibility ratings. After-sensor effects were also observed: Control speakers spoke faster following sensor removal, while PwPD demonstrated increased AAVS and were perceived as more natural. However, there was no compelling evidence that after-sensor effects differed between groups.
Conclusion: EMA sensors primarily impact sibilant fricative production and perceptions of intelligibility and naturalness in PwPD and Control speakers. PwPD experience greater sensor-related reductions in intelligibility, which should be carefully considered when using speech data collected with EMA to assess perceptual measures in clinical populations. Finally, PwPD exhibited increased naturalness and greater spectral distinctiveness following sensor removal, suggesting potential short-term carryover of compensatory sensor adaptation strategies.
Introduction
Historically, our understanding of motor speech disorders, like dysarthria, has relied on perceptual and acoustic data. These methods are well-suited for measuring the phonatory, resonatory, and prosodic deficits associated with dysarthria. However, using perceptual and acoustic data to make inferences about the underlying articulatory movement is complicated by motor equivalence, which refers to the idea that multiple articulatory gestures can produce the same acoustic signal (Brunner & Hoole, 2012; Hughes & Abbs, 1976; Perkell et al., 1993; Perrier & Fuchs, 2015). For this reason, kinematic analysis methods are beneficial because they allow researchers to directly examine articulatory movement.
Among various kinematic methods, such as ultrasound and palatography (Hardcastle et al., 1991; Klein et al., 2013; McAuliffe et al., 2006a, 2006b), electromagnetic articulography (EMA) systems are among the most commonly used kinematic methods (Berry, 2011; Kim et al., 2024; Savariaux et al., 2017). By providing data on articulatory working space, displacement, speed, movement variability, and interarticulator coordination (Chu et al., 2020; Lee et al., 2017; Masapollo & Nittrouer, 2023; Mefferd, 2015; Rong et al., 2012; Teplansky et al., 2023; Thompson & Kim, 2024), EMA systems offer valuable kinematic data, which complements and triangulates the relatively more extensive literature on acoustic and perceptual data, which can provide a more nuanced understanding of speech motor control, particularly in populations with neurological speech impairments.
While EMA methods offer advantages, they also pose distinct challenges. EMA systems use strategically placed sensors on the lips, tongue, and jaw to track speech movement (Rebernik et al., 2021). These systems employ small sensors (e.g., 2 x 2 mm for the Wave System; NDI, Canada) connected to the measurement device by thin wires (e.g., .4 mm in diameter for the Wave System; NDI, Canada). The presence of these sensors may alter natural speech production because they introduce a steady-state perturbation to the speech system, potentially leading to variability in the acoustic and perceptual measures collected. Thus, understanding the effects of sensor placement on speech production is essential, particularly when these systems are used in clinical research to study populations with neurological speech impairments, such as dysarthria secondary to Parkinson’s disease, who may be more impacted by wearing these sensors.
The purpose of the current study was to examine the impact of EMA sensors on people with Parkinson’s disease (PwPD). Parkinson’s disease is a progressive neurodegenerative disorder that causes hypokinetic dysarthria in approximately 90% of cases (Ho et al., 1999; Moya-Galé & Levy, 2019). Hypokinetic dysarthria is characterized by a reduced range of articulatory gestures (Mefferd, 2015; Mefferd & Dietrich, 2019; Thompson & Kim, 2024), as well as perceptual qualities such as vocal breathiness, monopitch, monoloudness, short rushes of speech, and imprecise articulation (Darley et al., 1969a, 1969b; Duffy, 2020). These deficits typically cause decreased intelligibility and naturalness (Anand & Stepp, 2015; De Bodt et al., 2002; Plowman-Prine et al., 2009), which can have a negative impact on communicative participation and quality of life (Borrie et al., 2022; Spencer et al., 2020). Acoustically, PwPD often demonstrate smaller acoustic working space (e.g., smaller acoustic vowel space area (aVSA) or articulatory acoustic vowel space [AAVS]) and reduced spectral contrastivity in fricatives, indicating diminished articulatory excursions and overall reduced articulatory precision (Bang et al., 2013; Lam & Tjaden, 2016; McRae et al., 2002, 2002; Tjaden et al., 2013; Whitfield & Mehta, 2019). Given these articulatory deficits in PwPD, EMA is a well-suited method for directly capturing and assessing kinematic movement in PwPD. However, it is not well understood how the presence of EMA sensors might impact speech production in PwPD.
Sensor Effects
Investigations into the impact of EMA sensors on speech have primarily been motivated by assessing the external validity of EMA findings. In other words, if EMA sensors systematically alter speech production or its perception, then caution should be exercised when generalizing results from EMA studies to study findings without kinematic data. A few studies have directly investigated the impact of kinematic sensors on speech production in neurologically healthy speakers, as summarized below.
Sensor effects have primarily been examined for fricative consonant production, specifically /s/ and /ʃ/. These sibilant fricatives require precise lingual-alveolar constriction and are, therefore, likely to be impacted by the presence of lingual sensors, which are often placed .5-2 cm from the tongue tip (Rebernik et al., 2021). Fricatives are typically studied using spectral moment analyses (Forrest et al., 1988), with spectral moments one (M1) and two (M2) representing the mean (spectral center of gravity) and standard deviation (spectral standard deviation) of spectral energy, respectively. M1 provides information about the place of articulation and has an inverse relationship to the size of the front cavity of the oral constriction. Therefore, M1 values are typically higher for /s/ compared to /ʃ/ (Jongman et al., 2000). In contrast, the articulatory basis of M2 is less well understood, but likely distinguishes sibilant from non-sibilant consonants and/or place of articulation for fricatives (Jongman et al., 2000; Koenig et al., 2013; Petrović, 2020). Therefore, M2 may still be relevant when considering sensor effects.
There is evidence that EMA sensors impact sibilant fricative production in healthy speakers. Dromey et al. (2018) examined EMA sensor effects on /s/ and /ʃ/ production and observed group-level sensor effects in neurologically healthy speakers, including decreased M1 values for /s/ and increased M2 values for /ʃ/, suggesting a less forward place of constriction for /s/ (hence, a larger front cavity) and likely compensatory articulatory changes for /ʃ/. In contrast, Weismer & Bunton (1999) studied the effect of X-ray microbeam pellet placement1 on /s/ and /ʃ/ production in speakers without neurological speech impairment and found about 20% of the speakers showed increased M1 values with pellets on compared to pellets off, indicating a smaller front cavity and a more forward constriction. Although these studies present opposing findings regarding the impact of sensors/pellets on M1, they both suggest that the presence of sensors impacts sibilant fricative pro
EMA sensors may also lead to alterations in vowel articulation and working space in healthy speakers. The impact of sensors on acoustic working space has only been studied in a couple of studies, and the findings have been mixed. Weismer & Bunton (1999) found that some speakers had higher first formant frequency (F1) values and lower second formant frequency (F2) values during vowel production with the pellets on, suggesting a greater mouth opening (likely due to greater jaw movement) and more retracted tongue position, likely to avoid contact between the lingual pellets and the alveolar ridge. In a recent study, Tienkamp et al. (2024) found neurologically healthy speakers have reduced AAVS following EMA sensor placement, indicating a reduced articulatory working space with EMA sensors. The contrasting results between these two studies may be attributed to the varying kinematic methods employed (EMA systems with wired sensors versus X-ray microbeam with wireless pellets). Nevertheless, both studies suggest that lingual sensors may lead to alterations in vowel articulation, either resulting in reduced or exaggerated compensatory movements.
Additionally, there is some evidence that EMA sensors can lead to perceptually degraded speech. Weismer & Bunton (1999) found no consistent impact of pellets on perceptual judgments of articulatory precision, while Dromey et al. (2018) found reduced ratings of articulatory precision with EMA sensors on compared to before EMA sensor placement. More work is needed to determine the impact of EMA sensors on perceptual judgments of articulatory precision. For intelligibility, Meenakshi et al. (2014) found that listeners’ forced-choice intelligibility judgments for various VCV stimuli were significantly lower with sensors compared to without sensors. The limited number of studies on the impact of EMA sensors on various perceptual constructs highlights the need for further research to understand the impact of EMA sensors on various perceptual dimensions. Moreover, the impact of EMA sensors on some crucial perceptual constructs, like speech naturalness, remains unexplored.
Understanding how EMA sensors impact speech perception is essential for both methodological and theoretical purposes. From a methodological perspective, if EMA methods are used to evaluate the effectiveness of speech therapy treatments (e.g., simultaneously examining perceptual and kinematic responses to behavioral cues, like speaking louder, slower, or more clearly Kearney et al., 2017; Thompson & Kim, 2024), it is crucial to account for the potential effects of sensor presence on perceptual outcomes. While speech therapy aims to enhance perceptual outcomes, the presence of sensors may degrade them, potentially confounding or obscuring perceptual treatment effects. From a theoretical perspective, linking acoustic changes to perceptual outcomes is essential for understanding the success of compensatory articulatory strategies that speakers may employ in response to EMA sensors. If speakers can modify their articulation to counteract the perturbation introduced by the sensors while maintaining perceptual outcomes (e.g., intelligibility and naturalness), this suggests a level of sensorimotor flexibility in speech motor control in which speakers successfully integrate auditory and somatosensory feedback to adjust their speech motor plans in response to the EMA sensors. However, if sensor-induced articulatory changes do not preserve perceptual outcomes, it may indicate limitations in a speaker’s ability to adjust for sensor presence effectively. Therefore, examining the relationship between acoustic and perceptual measures in the presence of EMA sensors not only informs methodological considerations for speech kinematics research but also may provide indirect insights into how speakers use sensory feedback to maintain intelligibility and naturalness in response to articulatory perturbations.
Given that EMA is well-suited to characterize the articulatory deficits of clinical populations, it is crucial to understand how these populations are affected by the presence of sensors. This understanding has important implications for the validity of between-group comparisons. If sensor effects influence all speakers similarly, then researchers can assume that sensor-induced variability does not confound comparisons between speakers with and without motor speech disorders. However, if individuals with motor speech disorders are disproportionately affected by sensors, then comparisons of articulatory movements across groups could be misleading if these unique sensor effects are not appropriately accounted for.
Furthermore, PwPD might be uniquely affected by the somatosensory perturbation caused by the EMA sensors. As previously stated, compensating for the presence of EMA sensors likely requires auditory and somatosensory acuity. However, PwPD have been shown to have auditory (Chen & Watson, 2017; Mollaei et al., 2016) and somatosensory deficits (Chen & Watson, 2017; Hammer & Barlow, 2010; Schneider et al., 1986). Chen & Watson (2017) found that PwPD had reduced tactile acuity of the tongue tip, which was related to reduced spectral contrasts between /s/ and /ʃ/. These findings support the hypothesis that PwPD might be less affected by the perturbation introduced by sensors. Conversely, Hammer & Barlow (2010) found reduced laryngeal somatosensory acuity in PwPD, leading to the hypothesis that PwPD may have compensatory supralaryngeal somatosensory acuity (Mollaei et al., 2016). If this hypothesis is correct, PwPD may be more susceptible to the perturbation introduced by sensors. Simply, more work is needed to understand how PwPD might be uniquely affected by EMA sensors.
To our knowledge, only two studies have examined the effects of EMA sensors in clinical populations (Katz et al., 2006; Tienkamp et al., 2024). The first study investigated individuals with aphasia and apraxia of speech, finding that they exhibited greater changes in vowel formants and spectral measures compared to neurotypical controls (Katz et al., 2006). These findings suggest that EMA sensors may disproportionately impact individuals with aphasia/apraxia. The second study examined the effects of EMA sensors in PwPD (Tienkamp et al., 2024). This study included 46 speakers (23 control speakers, 23 PwPD) and assessed AAVS before and after the placement of five EMA sensors: one on the jaw, two on the lips, and two on the tongue (1 cm from the tongue tip and 5 cm anterior to the /k/ constriction). Both groups exhibited reduced AAVS following sensor placement. However, unlike the findings of Katz et al. (2006), the sensor effects were comparable between PwPD and control speakers, suggesting that PwPD were not differentially impacted. Further research is needed to replicate these findings and to explore the disorder-specific effects of EMA sensors on fricative production and perceptual outcomes.
After-Sensor Effects
Examining speech after sensor removal (i.e., after-sensor effects) may provide additional insights beyond sensor effects alone. To our knowledge, no studies have investigated the after-effects of EMA sensor removal. However, research on other somatosensory perturbations, such as mechanical jaw loads (Nasir & Ostry, 2006; Tremblay et al., 2003) and dental prostheses (Hamlet & Stone, 1976), suggests that after-effects typically manifest as compensatory responses in the opposite direction of the perturbation. For instance, studies that have applied a mechanical load to the jaw have found that speakers adapt their jaw movements to counteract the load, and when the load is removed, their jaw may initially deviate in the opposite direction (Nasir & Ostry, 2006; Tremblay et al., 2003). Given that EMA sensors introduce a somatosensory perturbation that may alter vowel and fricative production, it is reasonable to hypothesize that there may be a period of readjustment following sensor removal as the articulators return to their natural movement patterns.
Investigating after-effects in PwPD may be particularly beneficial, given their characteristic hypokinetic dysarthria. If EMA sensors restrict a speakers’ range of motion, as suggested by findings of reduced acoustic distinctiveness and perceptions of precision (Dromey et al., 2018; Tienkamp et al., 2024), speakers may compensate by making larger articulatory gestures while wearing sensors. If these compensatory adjustments persist after sensor removal, they could possibly yield perceptual benefits. This would be particularly beneficial for PwPD, given that hypokinetic dysarthria is characterized by reduced amplitude of articulatory movements, vowel centralization, and decreased spectral contrastivity in fricatives (Mefferd & Dietrich, 2019; Thompson & Kim, 2024; Tjaden & Wilding, 2004; Weismer et al., 2001).
Research on after-effects following speech-related somatosensory perturbations in PwPD is limited. However, insights can be drawn from research on sensorimotor adaptation, which often uses auditory feedback paradigms. These studies have shown that both PwPD and control speakers exhibit some degree of maintained adaptation to F1 formant perturbations even after the perturbation is removed (Abur et al., 2018; Miller et al., 2023; Mollaei et al., 2013; Purcell & Munhall, 2006; Villacorta et al., 2007). However, it is important to note that after-effects are not typically the focus of these studies, and individual variability is observed. Beyond speech, after-effects have been documented in PwPD and healthy individuals following sensorimotor perturbations in various motor tasks, such as walking (Bultitude et al., 2012; Roemmich et al., 2014; Sorrento et al., 2018), pointing (Buch et al., 2003; Contreras-Vidal & Buch, 2003), and throwing (Martin et al., 1996). However, unlike these studies, which primarily manipulate visual or auditory feedback, EMA sensors introduce a somatosensory perturbation, warranting further investigation into their unique after-effects.
Given the available literature, if control speakers and PwPD adapt to the presence of EMA sensors, it is possible that they may also show beneficial after-sensor effects if they maintain these compensatory strategies after the sensors are removed. Furthermore, given the speculation that PwPD may be differentially impacted by the somatosensory perturbation introduced by the sensors, it is reasonable to assume that the after-effects following EMA sensor removal may be different in PwPD. This could have implications for understanding how speech-motor learning and compensatory strategies are maintained over time.
The Current Study
This study examines the effects of EMA sensors on PwPD with hypokinetic dysarthria and neurologically healthy control speakers, focusing on both sensor presence (sensor effects) and post-sensor removal (after-sensor effects). An additional aim is to determine whether EMA sensors impact PwPD differently compared to control speakers, thereby assessing the external validity of EMA data. To explore these effects, we used spectral moment analyses (M1 and M2) to evaluate sibilant fricative production (/s/ and /ʃ/), analyzed AAVS to examine articulatory working space, and gathered perceptual ratings of intelligibility and naturalness. Our research questions are: (1) Do EMA sensors affect acoustic and perceptual measures in PwPD and control speakers (Before Sensors vs. With Sensors)? If so, do the effects differ between groups? and (2) Are there after-sensor effects in PwPD and control speakers (Before Sensors vs. After Sensors)? If so, do the effects differ between groups?
Based on prior studies (Dromey et al., 2018; Tienkamp et al., 2024; Weismer & Bunton, 1999), we hypothesize that both groups will show sensor effects, reflected by a decrease in perceptual and acoustic measures, except for M2, with sensors on compared to before sensor placement. For M2, we expect an increase with sensors, indicating a wider spread of spectral movement values. Further, given evidence of somatosensory deficits in PwPD (Chen & Watson, 2017; Hammer & Barlow, 2010; Schneider et al., 1986), we hypothesize that PwPD may be less affected by the somatosensory perturbation introduced by the EMA sensors. As a result, they may demonstrate smaller and less effective compensatory changes in their motor plans in response to the EMA sensors. Similarly, we predict after-sensor effects for both groups, reflected by increases in most measures (except for M2) following sensor removal. However, we expect these compensatory carryover effects to be smaller in magnitude for PwPD, given their auditory and somatosensory deficits, as well as their underlying dysarthria.
Method
The data for this study was collected as part of a larger kinematic and acoustic study in the Florida State University (FSU) Motor Speech Laboratory. The procedures outlined below were approved by the Florida State University’s Institutional Review Board (FSU IRB: 00002525).
Speaker Data
Speakers
A total of 34 speakers were included in the study, including 13 PwPD and 21 Control speakers. Table 1 provides a summary of the demographic information for both groups, and detailed participant-level descriptions are available in Supplemental Tables 1 and 2 (https://osf.io/bhfgc). While efforts were made to match the two groups in terms of age and sex, there were some discrepancies. The Control group included more female speakers (12 female, 9 male) and was younger on average (M = 64.33 years) compared to the PwPD group (4 female, 9 male; M = 71.00 years). The PwPD varied in years since diagnosis, ranging from 2 to 15 years (M = 7.11 years), and exhibited a wide range of hypokinetic dysarthria severity, from mild to profound. All PwPD were evaluated in their on-medication state, and none had undergone deep brain stimulation.
Table 1
Data Collection
Acoustic and kinematic data were collected simultaneously in a sound-attenuating booth using the Wave system and Wavefront (NDI, n.d.) with an AKG C1000S microphone placed approximately 30 cm from the speaker recording the speech stimuli. The acoustic data had a sampling rate of 20 kHz and 16-bit resolution. Kinematic data were not analyzed in the current study, as kinematic data were not available before sensor application and after sensor removal. Therefore, speech outcomes were limited to acoustic and perceptual measures. Five five-degrees-of-freedom (5DOF) sensors, 2 mm in diameter, were affixed to various articulators, including two lingual sensors, the tongue front (affixed medially 2 cm from the tongue tip) and tongue back (affixed medially 3 cm from the tongue front sensor), two labial sensors (affixed to the upper and lower vermilion lip border, respectively), and a jaw sensor (adhered to the labial surface of the central lower incisors). Additionally, a six-degrees-of-freedom (6DOF) reference sensor for head movements was attached to the bridge of a pair of glasses. The sensors were adhered to the articulators using PeriAcryl Oral Tissue Adhesive, a non-toxic dental surgical glue. All speakers completed each speech task with all six sensors attached. For a few participants, sensors may have become unattached during a speech task. However, in these cases, the sensors were reattached, and the recording was restarted.
The speakers read the Caterpillar Passage (Patel et al., 2013) at three different time points: (1) before sensor placement (Before Sensors), (2) approximately 10 minutes after sensor placement (With Sensors), to allow for adaptation to the sensors (Dromey et al., 2018), and (3) after sensor removal (After Sensors). The speakers were instructed to read the passage in their everyday conversational voice. Other speech tasks were performed between these recordings but were not analyzed for the current study. The entire data collection session lasted about two hours, with the three Caterpillar Passage readings consistently recorded in the same sequence. The average time between the Before Sensors and With Sensors recordings was 26.26 minutes (SD = 10.55). The time between the Before Sensors and After Sensors recordings was 56.37 minutes (SD = 7.34). Finally, the average time between the last recording with sensors and the After Sensors recording was 5.21 minutes (SD = 2.22).
Table 2
| Section | Passage Text1 |
|---|---|
| Section 1 | Do you like amusement parks? Well, I sure do. To amuse myself, I went twice last spring. My most MEMORABLE moment was riding on the Caterpillar, which is a gigantic rollercoaster high above the ground. When I saw how high the Caterpillar rose into the bright blue sky, I knew it was for me. |
| Section 2 | After waiting in line for thirty minutes, I made it to the front where the man measured my height to see if I was tall enough. I gave the man my coins, asked for change, and jumped on the cart. Tick, tick, tick, the Caterpillar climbed slowly up the tracks. It went SO high I could see the parking lot. Boy, was I SCARED! I thought to myself, ‘There’s no turning back now.’ |
| Section 3 | People were so scared they screamed as we swiftly zoomed fast, fast, and faster along the tracks. As quickly as it started, the Caterpillar came to a stop. Unfortunately, it was time to pack the car and drive home. That night I dreamt of the wild ride on the Caterpillar. Taking a trip to the amusement park and riding on the Caterpillar was my MOST memorable moment ever! |
| 1 Bold text indicates the three segments that were used to calculate the articulation rate. | |
Acoustic Measures
Four acoustic measures were analyzed at each of the three time points: Before Sensors, With Sensors, and After Sensors. The target speech segments were manually segmented using the TextGrid function in Praat (Boersma & Weenink, 2021). Acoustic analyses were conducted in the R statistical environment [R Core Team (2023); Version 4.3.2] using the rPraat package [Bořil & Skarnitzl (2016); Version 1.3.2-1], which is an interface for using Praat in R.
Articulation Rate (syl/s). Articulation rate was calculated as the number of syllables per second measured from breath groups. Breath groups were identified in three sentences from the Caterpillar passage (bolded in Table 2), chosen to capture variability in length, complexity, and prosody (i.e., declarative, exclamative, and interrogative). Breath group boundaries were identified by (1) audible breaths during the sentence or (2) silent pauses longer than 150 ms.
Articulatory Acoustic Vowel Space (AAVS; mel2). The AAVS was calculated based on the methods described in Whitfield & Goberman (2014) and Whitfield & Mehta (2019), with minor modifications to be more directly comparable to the methods of Tienkamp et al. (2024). Using Praat, we extracted the formant trajectory trace for the entire passage reading by generating Linear Predictive Coding (LPC) values for F1 and F2 at every five milliseconds of the passage reading (Burg method; window length = 0.025 s; time step = 0.005 s; max number of formants: 5; formant ceiling: 5000 Hz [male], 5500 Hz [female]). Then, voiceless segments were filtered out of the data to obtain only the periodic, voiced segments. Voicing was determined by identifying intervals with F0 data exceeding 20 ms (Whitfield & Mehta, 2019). Next, we applied a two-step process to filter outliers. Local outliers were removed using a median absolute deviation filter, eliminating data points exceeding 2.5 times the median absolute deviation (Tienkamp et al., 2024). For bivariate outliers, formant data were low-pass filtered at 10 Hz, and Mahalanobis distances were computed for each F1–F2 pair. Pairs exceeding 2 SDs from the centroid were excluded (Whitfield & Mehta, 2019).
The cleaned formant data were then transformed into mel values to facilitate direct comparison with findings from Tienkamp et al. (2024). To derive the AAVS, the covariance matrix of F1 and F2 was first calculated to capture both the individual variability of each formant and their co-variation. The overall spread of the data in the F1–F2 plane was then determined by computing the determinant of this matrix, known as the generalized variance. Finally, taking the square root of the generalized variance provided a measure comparable to a bivariate standard deviation. Higher AAVS values indicate more peripheral F1 and F2 values and, consequently, a larger articulatory–acoustic working space.
Spectral Moment Coefficients (kHz). M1 and M2 were calculated for the speaker’s production of /s/ and /ʃ/ (Forrest et al., 1988). One token of each fricative was manually segmented from the Caterpillar passage: “saw” for /s/ and “sure” for /ʃ/. M1, which represents the weighted average frequency of the fricative’s spectrum, was obtained using Praat’s “Get centre of gravity…” function. M2, which measures how much the frequencies deviate from the center of gravity (M1), was calculated using the “Get standard deviation…” function. The final spectral measures were expressed in kHz.
Perceptual Data
Listeners
A total of 79 listeners were recruited from undergraduate communication science and disorders courses at Florida State University to provide perceptual ratings. The full demographic information for the listeners is provided in Supplemental Table 3 (https://osf.io/bhfgc). To summarize, the listeners were women between 18 and 23 years old, predominantly white, and not Hispanic or Latino. While listeners’ hearing was not formally tested, none reported a history of hearing or communication disorders.
Data Collection & Perceptual Measures
To obtain perceptual ratings of intelligibility and naturalness, listeners completed an online perceptual experiment programmed using Gorilla [Anwyl-Irvine et al. (2020); http://www.gorilla.sc/]. Listeners heard the raw, non-intensity-normalized audio samples and rated intelligibility and naturalness using a continuous 100-point horizontally oriented visual analog scale (VAS).
We chose not to intensity normalize the audio files to preserve the natural speech characteristics of our speakers, particularly for PwPD and dysarthria. Hypophonia, or reduced vocal intensity, is a hallmark feature of hypokinetic dysarthria, and intensity normalization would have amplified speakers’ voices, which may have artificially diminished the severity of the speakers’ dysarthria. However, we controlled for recording variability by ensuring a consistent speaker-to-microphone distance and maintaining identical microphone gain settings across all recordings. We also chose not to introduce multitalker babble or background noise, as our goal was to isolate the effects of EMA sensors on perceptual judgments in unaltered speech. This approach aligns with prior studies investigating EMA sensor effects (Dromey et al., 2018; Meenakshi et al., 2014; Weismer & Bunton, 1999). With these methodological decisions, we aimed to ensure that listener ratings reflect the combined perceptual consequences of both the dysarthria and the EMA sensors, without artificial enhancements or external confounds.
The left and right ends of the VAS corresponded to rating values of 0 and 100, respectively, which were not visible to the listener. Instead, the listeners were presented with left and right endpoints labeled as “cannot understand anything” and “understand everything” for intelligibility ratings (Tjaden et al., 2014), and “highly unnatural” and “highly natural” for naturalness ratings (Anand & Stepp, 2015). Listeners always completed a block of ratings for intelligibility first, then a block of ratings for naturalness.
Prior to making the ratings in each block, listeners were provided with instructions about the perceptual measure and how to use the VAS. Based on the consent form detailing the study, the listeners were made aware that they may hear individuals with motor speech disorders. However, the group membership (Control or PwPD) and time point (Before Sensors, With Sensors, and After Sensors) were masked to the listeners.
To minimize stimuli familiarization effects, the passage readings were split into three sections for the listeners to rate (Table 2). Additionally, the recording was only played once before listeners made their ratings. To minimize speaker familiarization effects, listeners rated half of the speakers (n = 17) on intelligibility and the other half on naturalness. Speakers were not repeated between the intelligibility and naturalness blocks. Finally, we made efforts to minimize familiarization effects statistically by entering trial order into our models as a control variable (see the Statistical Analysis section).
Additionally, four previously rated recordings were randomly selected for the listener to rate again to calculate intra-listener reliability. All passage sections were presented in a randomized order. Therefore, listeners completed a total of 21 ratings in each block: 17 passage recordings (one for each of the 17 speakers) and 4 randomly selected passage sections for intra-listener reliability. The perceptual rating task took approximately 15 to 20 minutes to complete.
Reliability
To ensure measurement reliability, the inter- and intra-measurer reliability was assessed for the acoustic measurements made by the researchers. For inter-measurer reliability, each examiner measured 20% of the other examiner’s data, and the two sets of measurements were evaluated using correlation analyses with the cor.test function in the stats package (R Core Team, 2023). Inter-measurer reliability was very strong for articulation rate (r = .96, p < .001), M1 (r = .99, p <.001), M2 (r = .94, p < .001), and AAVS (r = .99, p <.001). Similarly, intra-measurer reliability was assessed by having each examiner re-measure 20% of the data at least one month after the original measurement. The first and second sets of measurements were evaluated using correlation analyses. The intra-measurer reliability was very strong for articulation rate (r = .99, p <.001), M1 (r = .98, p <.001), M2 (r = .97, p < .001), and AAVS (r = 1.00, p <.001).
Additionally, intra-listener reliability was evaluated for the perceptual ratings provided by the listeners. During the perceptual experiment, four previously rated recordings were randomly selected for the listener to rate again. Intra-listener reliability was assessed with correlation analyses between the initial and repeated ratings, and the results indicated strong reliability for intelligibility (r = .88, p < .001) and moderate-to-strong reliability for naturalness (r = .77, p < .001).
Finally, inter-listener reliability was assessed by examining the mean (M) and standard deviation (SD) of the intelligibility and naturalness ratings for each speaker and time point (Hustad et al., 2015; Thompson & Kim, 2024)2. Because not every listener rated every speaker, traditional inter-listener reliability measures like intraclass correlation coefficients (ICC) were not appropriate. The SD of ratings ranged from 0.48 to 32.60 for intelligibility and 9.87 to 36.74 for naturalness. Lower SD values were observed for speakers at the extremes of the scales, while higher SD values were observed for speakers in the mid-range (Figure 1). These SD ranges are consistent with previous studies using VAS methods for perceptual ratings (Thompson & Kim, 2024).
Figure 1

Statistical Analysis
To address our research questions, we utilized a Bayesian hierarchical modeling approach. This approach allowed us to account for our modest sample size, quantify uncertainty in effect estimates, and interpret EMA sensor effects and after-sensor effects using descriptive probabilities. For a comprehensive overview of Bayesian mixed-effects modeling for speech data, see Nalborczyk et al. (2019). Statistical analyses were conducted in the R statistical environment [R Core Team (2023); Version 4.3.2] using Stan modeling language (Carpenter et al., 2017) via the brms package (version 2.21.0) (Bürkner, 2018) and the emmeans package (Length, 2023).
We constructed eight Bayesian mixed-effects models, one for each acoustic and perceptual outcome measure. The outcomes for the eight models were articulation rate, AAVS, M1 and M2 for /s/ and /ʃ/, and intelligibility and naturalness ratings, respectively. For each model, the interaction between speaker group (Group: Control [reference level] and PwPD) and time point (Time Point: Before Sensors [reference level], With Sensors, and After Sensors) were included as fixed effects. Additionally, speaker sex (Sex: male [reference level] and female), and speaker age (Age) were entered as covariates into the models to try to statistically control for the differences in sex and age across the two speaker groups. Each model included Speaker ID as a random intercept, to account for speaker variability. All models were specified with weakly informative priors, meaning we assumed no effect of Group, Time Point, Group × Time Point interaction, or any of the covariates on the target measures. Specifically, the models were specified with regularizing Gaussian priors for the intercept and slope coefficients (μ = 0, σ = 100), and a Cauchy distribution for the standard deviation parameter (μ = 0, σ = 100). For each outcome measure, model specifications were adapted based on the distribution characteristics of the data:
Articulation Rate. Articulation rate approximated a normal distribution. Therefore, the model was built using a Gaussian family function. In addition to the general model specifications described above, the random effect structure for the articulation rate model also included random intercepts for each phrase for each speaker (see the bolded phrases in Table 2) to allow intercepts to vary across the target phrases.
AAVS. The distribution of the AAVS measure was lognormal; thus, a lognormal link function was used. In addition to the general model specification, passage duration was also included as a fixed effect covariate, as longer passage durations would indicate slower speech rates, which is known to produce enlarged working spaces (Tjaden & Wilding, 2004).
Spectral Moment Measures (M1 & M2). The spectral moment values for /s/ and /ʃ/ approximated a normal distribution. Therefore, the models were built using Gaussian distributions. Beyond the general model specification described above, no additional fixed or random effects were entered into the models.
Perceptual Measures. Given that the intelligibility and naturalness distributions were bounded between 0 and 100, with a clustering of values near the lower and upper limits, we re-scaled these variables to a 0 to 1 range, allowing us to model the data appropriately using a Beta distribution. Additionally, Trial Order was entered into the models to control for any potential impact that familiarization and order effects had on the perceptual ratings. Finally, random effects for the perceptual models included random intercepts for passage section (see Table 2) per speaker, as well as random intercepts for Listener ID, to account for listener variability. The perceptual models used the same Gaussian and Cauchy priors as described above. Additionally, we employed gamma priors for the Beta distribution’s shape parameters with α = 1, β = .5.
Following the construction of these models, we answered our research questions by examining the pairwise comparisons between Before Sensors and With Sensors (RQ1, Sensor Effects) and Before Sensors and After Sensors (RQ2, After-Sensor Effects) for each speaker group using the emmeans package (Length, 2023). Additionally, interaction contrasts between groups were examined to determine whether these sensor effects (With Sensors - Before Sensors × Group) or after-sensor effects (After Sensors - Before Sensors × Group) differed between Control and PwPD groups.
The Markov chain Monte Carlo algorithm was used to implement the Bayesian models. Four sampling chains with 4000 iterations were run for each model, with a burn-in period of 1000 iterations. To assess the robustness of an effect, we report the 95% credible interval and probability of direction (pd, not to be confused with “Parkinson’s disease”) for each parameter. For the pairwise comparisons across time points, we report the 95% Highest Probability Density (HPD) interval. The 95% credible interval indicates that we are 95% confident that the true parameter value lies within the specified range. The 95% HPD interval, on the other hand, represents the range containing 95% of the most probable values of the parameter, based on the posterior distribution. The pd value indicates a greater probability that the effect is greater than zero. We determined whether there is compelling evidence of an effect by whether the 95% intervals overlap with zero and pd is greater than 95%.
Results
Table 3 presents summary statistics for the acoustic and perceptual measures across all speakers and by speaker sex. The main findings from the Bayesian models (i.e., sensor effects: With Sensors – Before Sensors; after-sensor effects: After Sensors – Before Sensors), are presented in Table 4 and Figures 2 – 7. Due to space constraints, full model summaries for the eight Bayesian models are provided in the Supplementary Information (see Supplemental Tables 4 – 7). We first report baseline group, sex, age, and trial order effects, followed by our primary analyses of sensor and after-sensor effects. Data preparation, visualization, and analysis code are available on our OSF project page (https://osf.io/n7kse/).
Table 3
| Measure |
Control
|
People with Parkinson’s disease (PwPD)
|
||||
|---|---|---|---|---|---|---|
| Before Sensors | With Sensors | After Sensors | Before Sensors | With Sensors | After Sensors | |
| All Speakers | ||||||
| Articulation Rate (syl/s) | 4.73 (.86) | 4.87 (.78) | 4.98 (.69) | 4.74 (.80) | 4.80 (.73) | 4.87 (.84) |
| Articulatory Acoustic Vowel Space (mel²) | 27603.88 (7643.89) | 26143.51 (7435.93) | 28194.31 (8998.68) | 18777.24 (4370.62) | 18433.20 (4395.77) | 20735.47 (4918.72) |
| M1 for /s/ (kHz) | 5.61 (.79) | 4.81 (.91) | 5.46 (.74) | 4.90 (1.18) | 4.53 (1.02) | 4.97 (1.09) |
| M2 for /s/ (kHz) | 2.71 (.34) | 2.82 (.32) | 2.78 (.38) | 2.71 (.31) | 2.91 (.17) | 2.77 (.38) |
| M1 for /ʃ/ (kHz) | 4.09 (.55) | 3.94 (.56) | 4.25 (.66) | 3.80 (.77) | 3.74 (.70) | 4.02 (1.02) |
| M2 for /ʃ/ (kHz) | 2.53 (.22) | 2.65 (.15) | 2.44 (.21) | 2.50 (.19) | 2.62 (.22) | 2.47 (.19) |
| Intelligibility (VAS) | 95.54 (10.01) | 92.98 (13.01) | 96.45 (9.33) | 87.89 (21.13) | 80.16 (25.52) | 85.96 (24.41) |
| Naturalness (VAS) | 72.95 (26.63) | 64.97 (27.74) | 75.30 (25.04) | 54.27 (31.79) | 43.81 (30.71) | 59.21 (30.42) |
| Female Speakers | ||||||
| Articulation Rate (syl/s) | 4.61 (.79) | 4.66 (.63) | 4.77 (.69) | 4.64 (.75) | 4.75 (.77) | 4.83 (.72) |
| Articulatory Acoustic Vowel Space (mel²) | 31369.97 (7555.95) | 30340.51 (6715.33) | 33045.91 (9068.73) | 20430.07 (2681.58) | 21605.86 (1813.22) | 23667.13 (2039.21) |
| M1 for /s/ (kHz) | 5.97 (.66) | 5.05 (.86) | 5.56 (.85) | 5.88 (.22) | 5.55 (.43) | 5.86 (.72) |
| M2 for /s/ (kHz) | 2.80 (.39) | 2.90 (.38) | 2.91 (.40) | 2.80 (.45) | 2.95 (.15) | 3.07 (.47) |
| M1 for /ʃ/ (kHz) | 4.23 (.48) | 4.11 (.52) | 4.38 (.45) | 4.23 (.52) | 4.12 (.48) | 4.70 (.40) |
| M2 for /ʃ/ (kHz) | 2.46 (.23) | 2.63 (.14) | 2.43 (.25) | 2.47 (.28) | 2.45 (.21) | 2.42 (.17) |
| Intelligibility (VAS) | 95.33 (11.08) | 92.97 (13.77) | 95.45 (11.52) | 92.77 (16.10) | 90.65 (17.01) | 95.98 (8.53) |
| Naturalness (VAS) | 74.35 (27.85) | 64.24 (29.10) | 73.55 (26.13) | 69.00 (29.42) | 59.91 (30.24) | 76.50 (24.42) |
| Male Speakers | ||||||
| Articulation Rate (syl/s) | 4.88 (.94) | 5.14 (.89) | 5.26 (.60) | 4.78 (.83) | 4.82 (.72) | 4.90 (.90) |
| Articulatory Acoustic Vowel Space (mel²) | 22582.43 (4234.24) | 20547.51 (3817.65) | 21725.52 (2641.07) | 18042.64 (4897.33) | 17023.14 (4525.66) | 19432.51 (5340.80) |
| M1 for /s/ (kHz) | 5.13 (.73) | 4.49 (.92) | 5.32 (.56) | 4.47 (1.18) | 4.08 (.86) | 4.57 (1.00) |
| M2 for /s/ (kHz) | 2.59 (.24) | 2.72 (.18) | 2.60 (.29) | 2.67 (.25) | 2.88 (.19) | 2.64 (.27) |
| M1 for /ʃ/ (kHz) | 3.90 (.60) | 3.72 (.57) | 4.06 (.87) | 3.61 (.81) | 3.57 (.74) | 3.72 (1.08) |
| M2 for /ʃ/ (kHz) | 2.61 (.19) | 2.67 (.17) | 2.46 (.17) | 2.51 (.15) | 2.69 (.19) | 2.49 (.20) |
| Intelligibility (VAS) | 95.84 (8.23) | 93.00 (12.01) | 97.76 (4.94) | 85.69 (22.76) | 75.13 (27.38) | 81.50 (27.67) |
| Naturalness (VAS) | 71.19 (25.02) | 65.99 (25.82) | 77.48 (23.52) | 47.65 (30.67) | 37.17 (28.47) | 51.76 (29.79) |
Group, Sex, Age, and Order Effects
Although group, sex, age, and trial order effects within the Before Sensors time point were not the primary focus of this study, their inclusion in our models as interaction terms (Group × Time Point) or covariates (sex, age, trial order) allowed us to examine these variables.
Group Effects. PwPD demonstrated robustly smaller AAVSs (β = -.29, pd = 100%, CI = [-.48 − -.09]) compared to control speakers at the baseline Before Sensors condition, after adjusting for age and sex. Conversely, PwPD and control speakers showed comparable articulation rates (β = .04, pd = 57%, CI = [-.39 − .46]), M1 (/s/: β = -.30, pd = 83%, CI = [-.91 − .32]; /ʃ/: β = -.06, pd = 60%, CI = [-.56 − .44]) and M2 values (/s/: β = .07, pd = 71%, CI = [-.18 − .31]; /ʃ/: β = -.06, pd = 78%, CI = [-.21 − .09]), intelligibility ratings (β = -.27, pd = 81%, CI = [-.89 − .33]) and naturalness ratings (β = -.61, pd = 95%, CI = [-1.29 − .08]) at the baseline Before Sensors condition.
Sex Effects. Female speakers demonstrated robustly larger AAVSs (β = .31, pd = 100%, CI = [.14 − .49]) and higher M1 and M2 values for /s/ (M1: β = .80, pd = 100%, CI = [.30 − 1.32]; M2: β = .22, pd = 99%, CI = [.02 − .42]), and higher M2 values for /ʃ/ (β = .22, pd = 99%, CI = [.02 − .42]) compared to male speakers, after adjusting for age and group. Male and female speakers did not robustly differ in their articulation rates (β = -.33, pd = 95%, CI = [-.71 − .06]), M2 values for /ʃ/ (β = -.09, pd = 93%, CI = [-.20 − .03]), intelligibility ratings (β = .35, pd = 90%, CI = [-.20 − .93]), or naturalness ratings (β = .31, pd = 83%, CI = [-.34 − .95]).
Age Effects. Older speakers were perceived to be less intelligible (β = -.03, pd = 98%, CI = [-.05 − -.003]) and natural (β = -.03, pd = 98%, CI = [-.06 − -.003]), and demonstrated reduced M1 values for /s/ (β = -.03, pd = 99%, CI = [-.05 − -.004]) in the Before Sensors time point, after adjusting for group and sex. In contrast, age did not robustly impact articulation rate (β = -.02, pd = 97%, CI = [-.04 − .001]), AAVS (β = -.002, pd = 70%, CI = [-.01 − .01]), M1 for /ʃ/ (β = -.02, pd = 94%, CI = [-.04 − .004]), or M2 measures (/s/: β = -.002, pd = 64%, CI = [-.01 − .01]; /ʃ/: β = .001, pd = 62%, CI = [-.005 − .01]).
Trial Order Effects. For the perceptual measures, trial order had no robust impact on listeners’ intelligibility ratings (β = -.01, pd = 96%, CI = [-.02 − .001]). However, listeners systematically rated samples as less natural the later they were presented in the perceptual experiment (β = -.01, pd = 99%, CI = [-.03 − -.001]). This tendency was consistent across both groups, regardless of the speaker’s sex or age.
Sensor Effects
Our first research question examined the impact of sensors (i.e., With Sensors – Before Sensors) on the various acoustic and perceptual measures in PwPD and Control speakers. Additionally, we were interested in understanding if the impact of sensors was comparable between the two groups (i.e., Group × Before Sensors – With Sensors). The findings are presented in the left column of Table 4 and visualized in the middle panel of Figures 2-7 for each measure.
Articulation Rate. Contingent on the data and model, Control speakers demonstrated a robust increase in articulation rate when wearing sensors, whereas PwPD speakers exhibited a smaller and less certain effect (middle panel of Figure 2). Specifically, there was a 98% probability that Control speakers increased their articulation rate with sensors compared to before sensors, whereas for PwPD speakers, this probability was only 78%, indicating weaker support. Despite these differing patterns, the between-group difference in sensor effects was not robustly supported (pd = 76%), suggesting no clear evidence of a difference in how PwPD and Control speakers responded to wearing sensors.
AAVS. Contingent on the data and model, Control speakers had a 96% probability of a reduced AAVS with sensors compared to before sensors; however, the 95% HPD interval crossed zero, indicating uncertainty and a lack of robust evidence for this effect (middle panel of Figure 3). In contrast, PwPD speakers showed even weaker evidence of reduced vowel space, with only a 72% probability. Additionally, the difference between groups in sensor effects was not robustly supported (pd = 81%), providing no clear evidence that PwPD and Control speakers responded differently to wearing sensors.
Figure 2

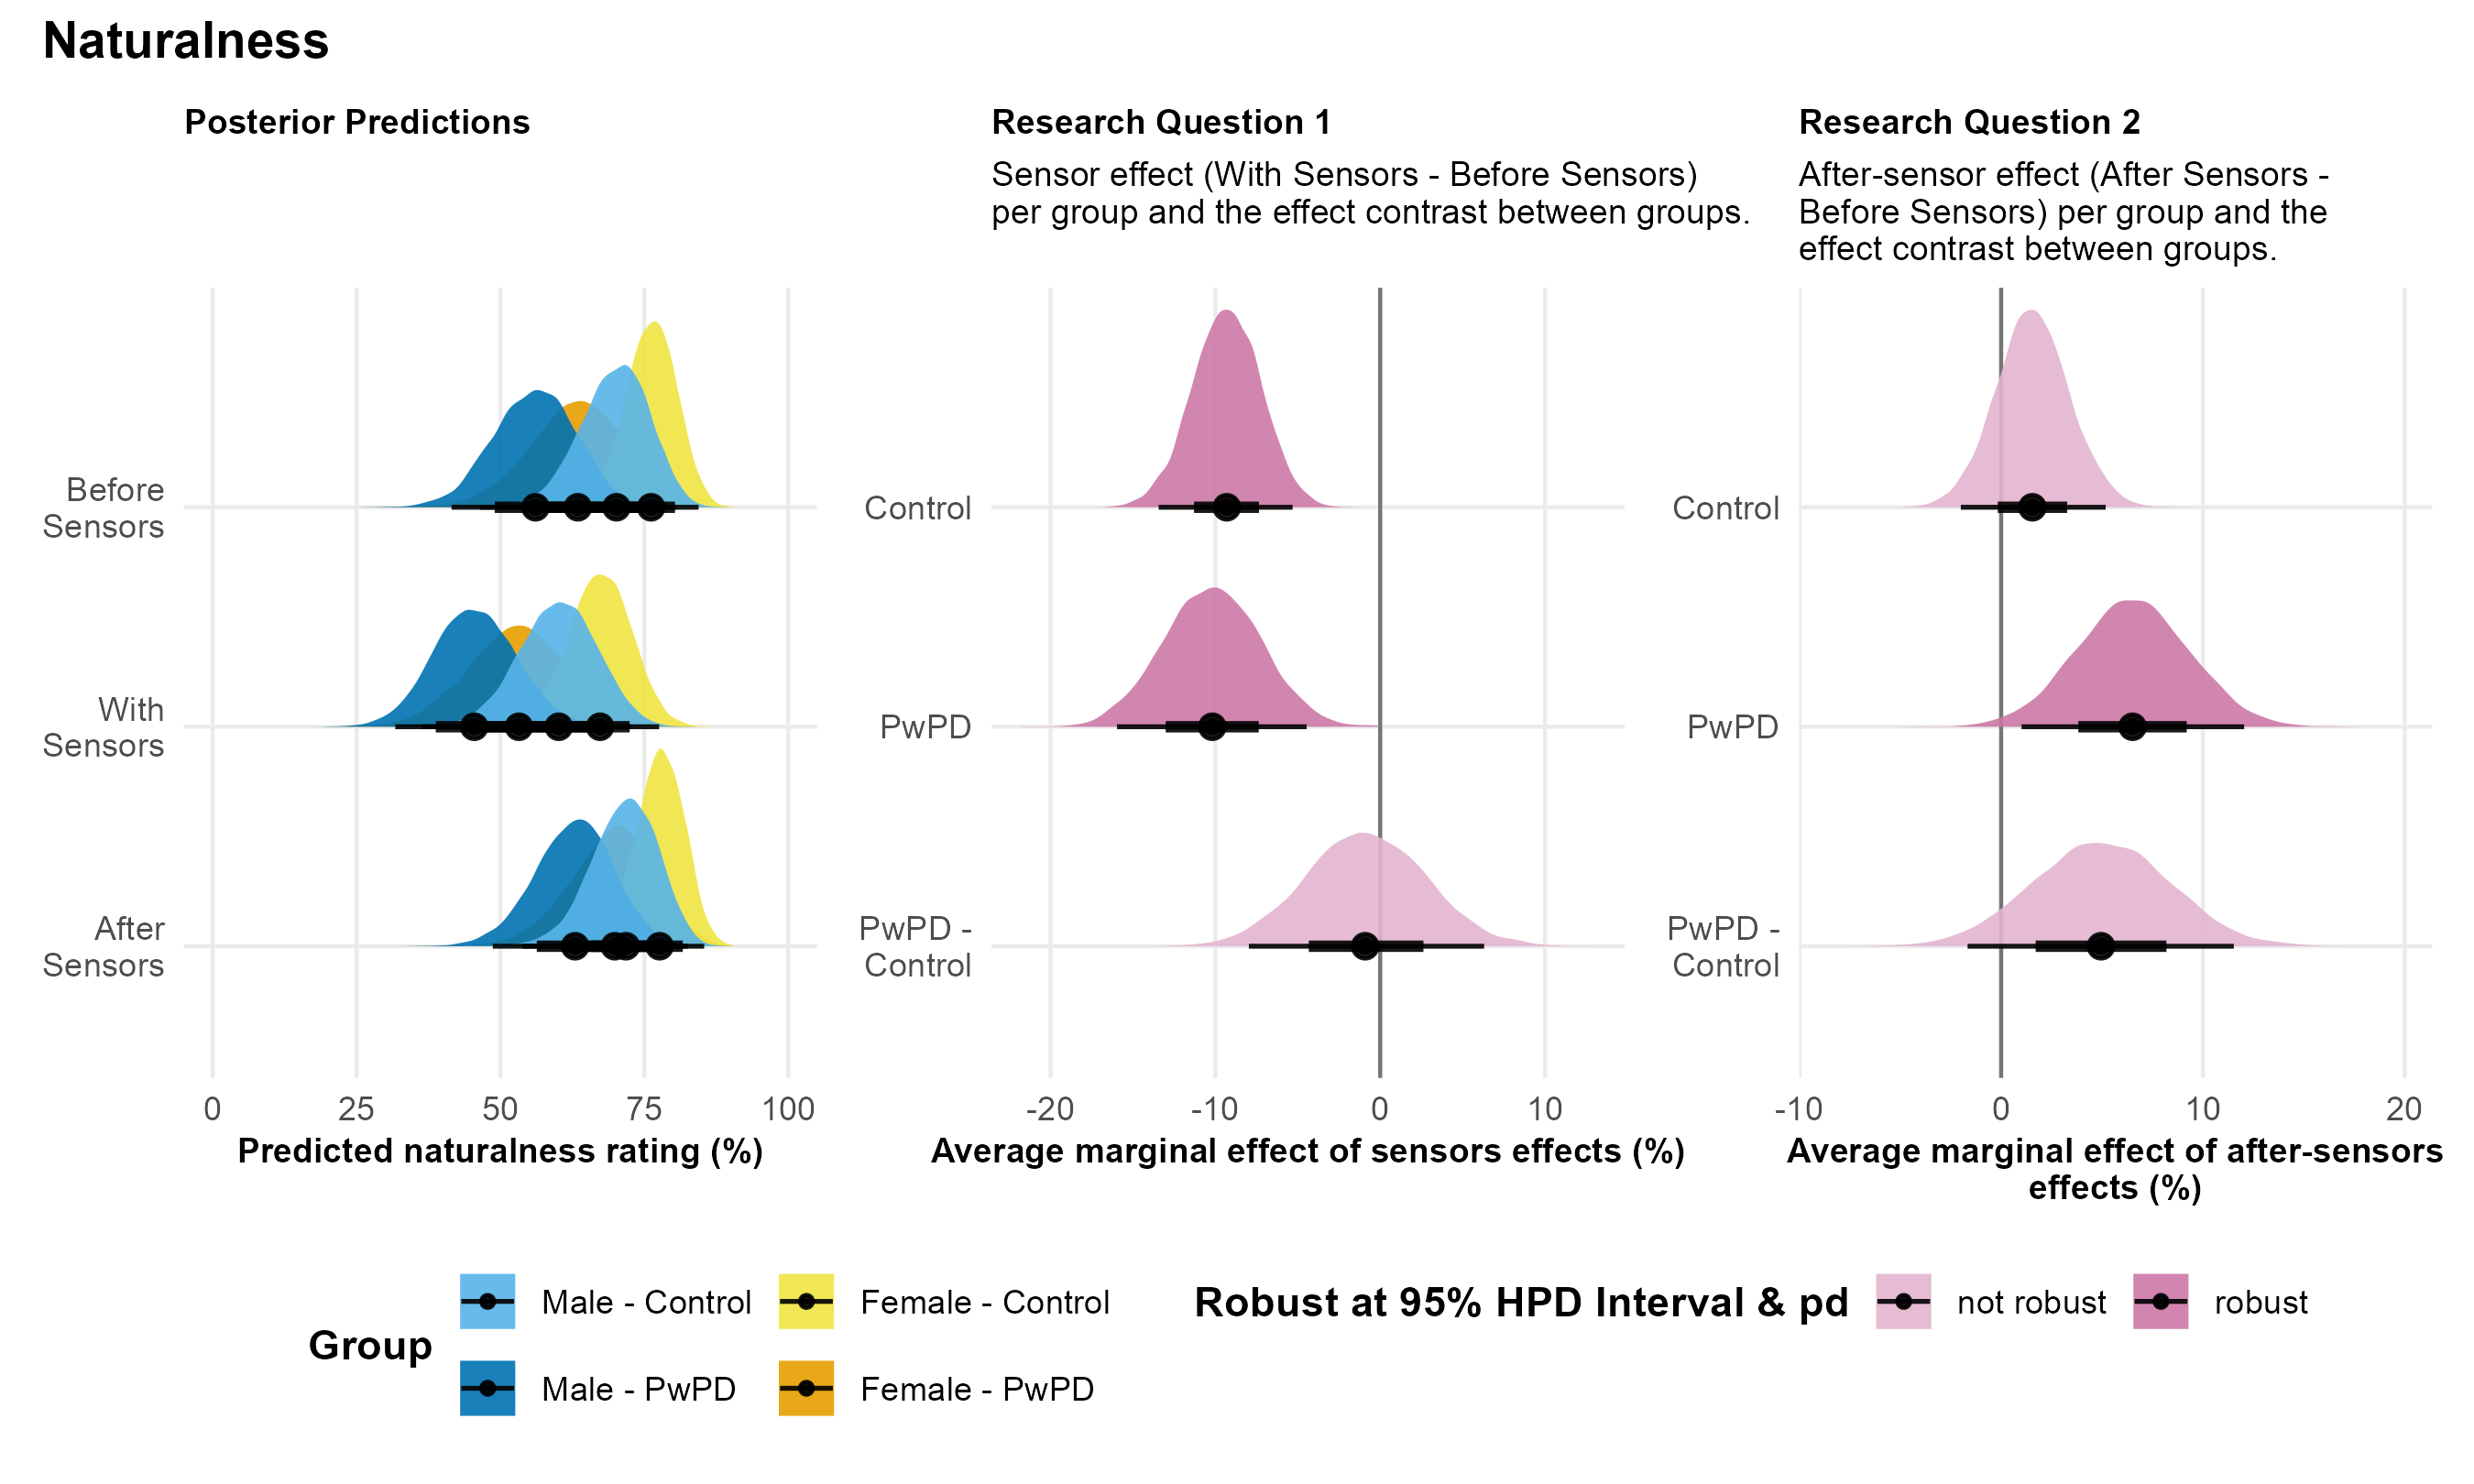
Note. The figure presents posterior predictions for articulation rate across speaker sex and group, as well as the main findings for Research Questions 1 and 2.
PwPD = People with Parkinson’s disease; pd = probability of direction.
Figure 3
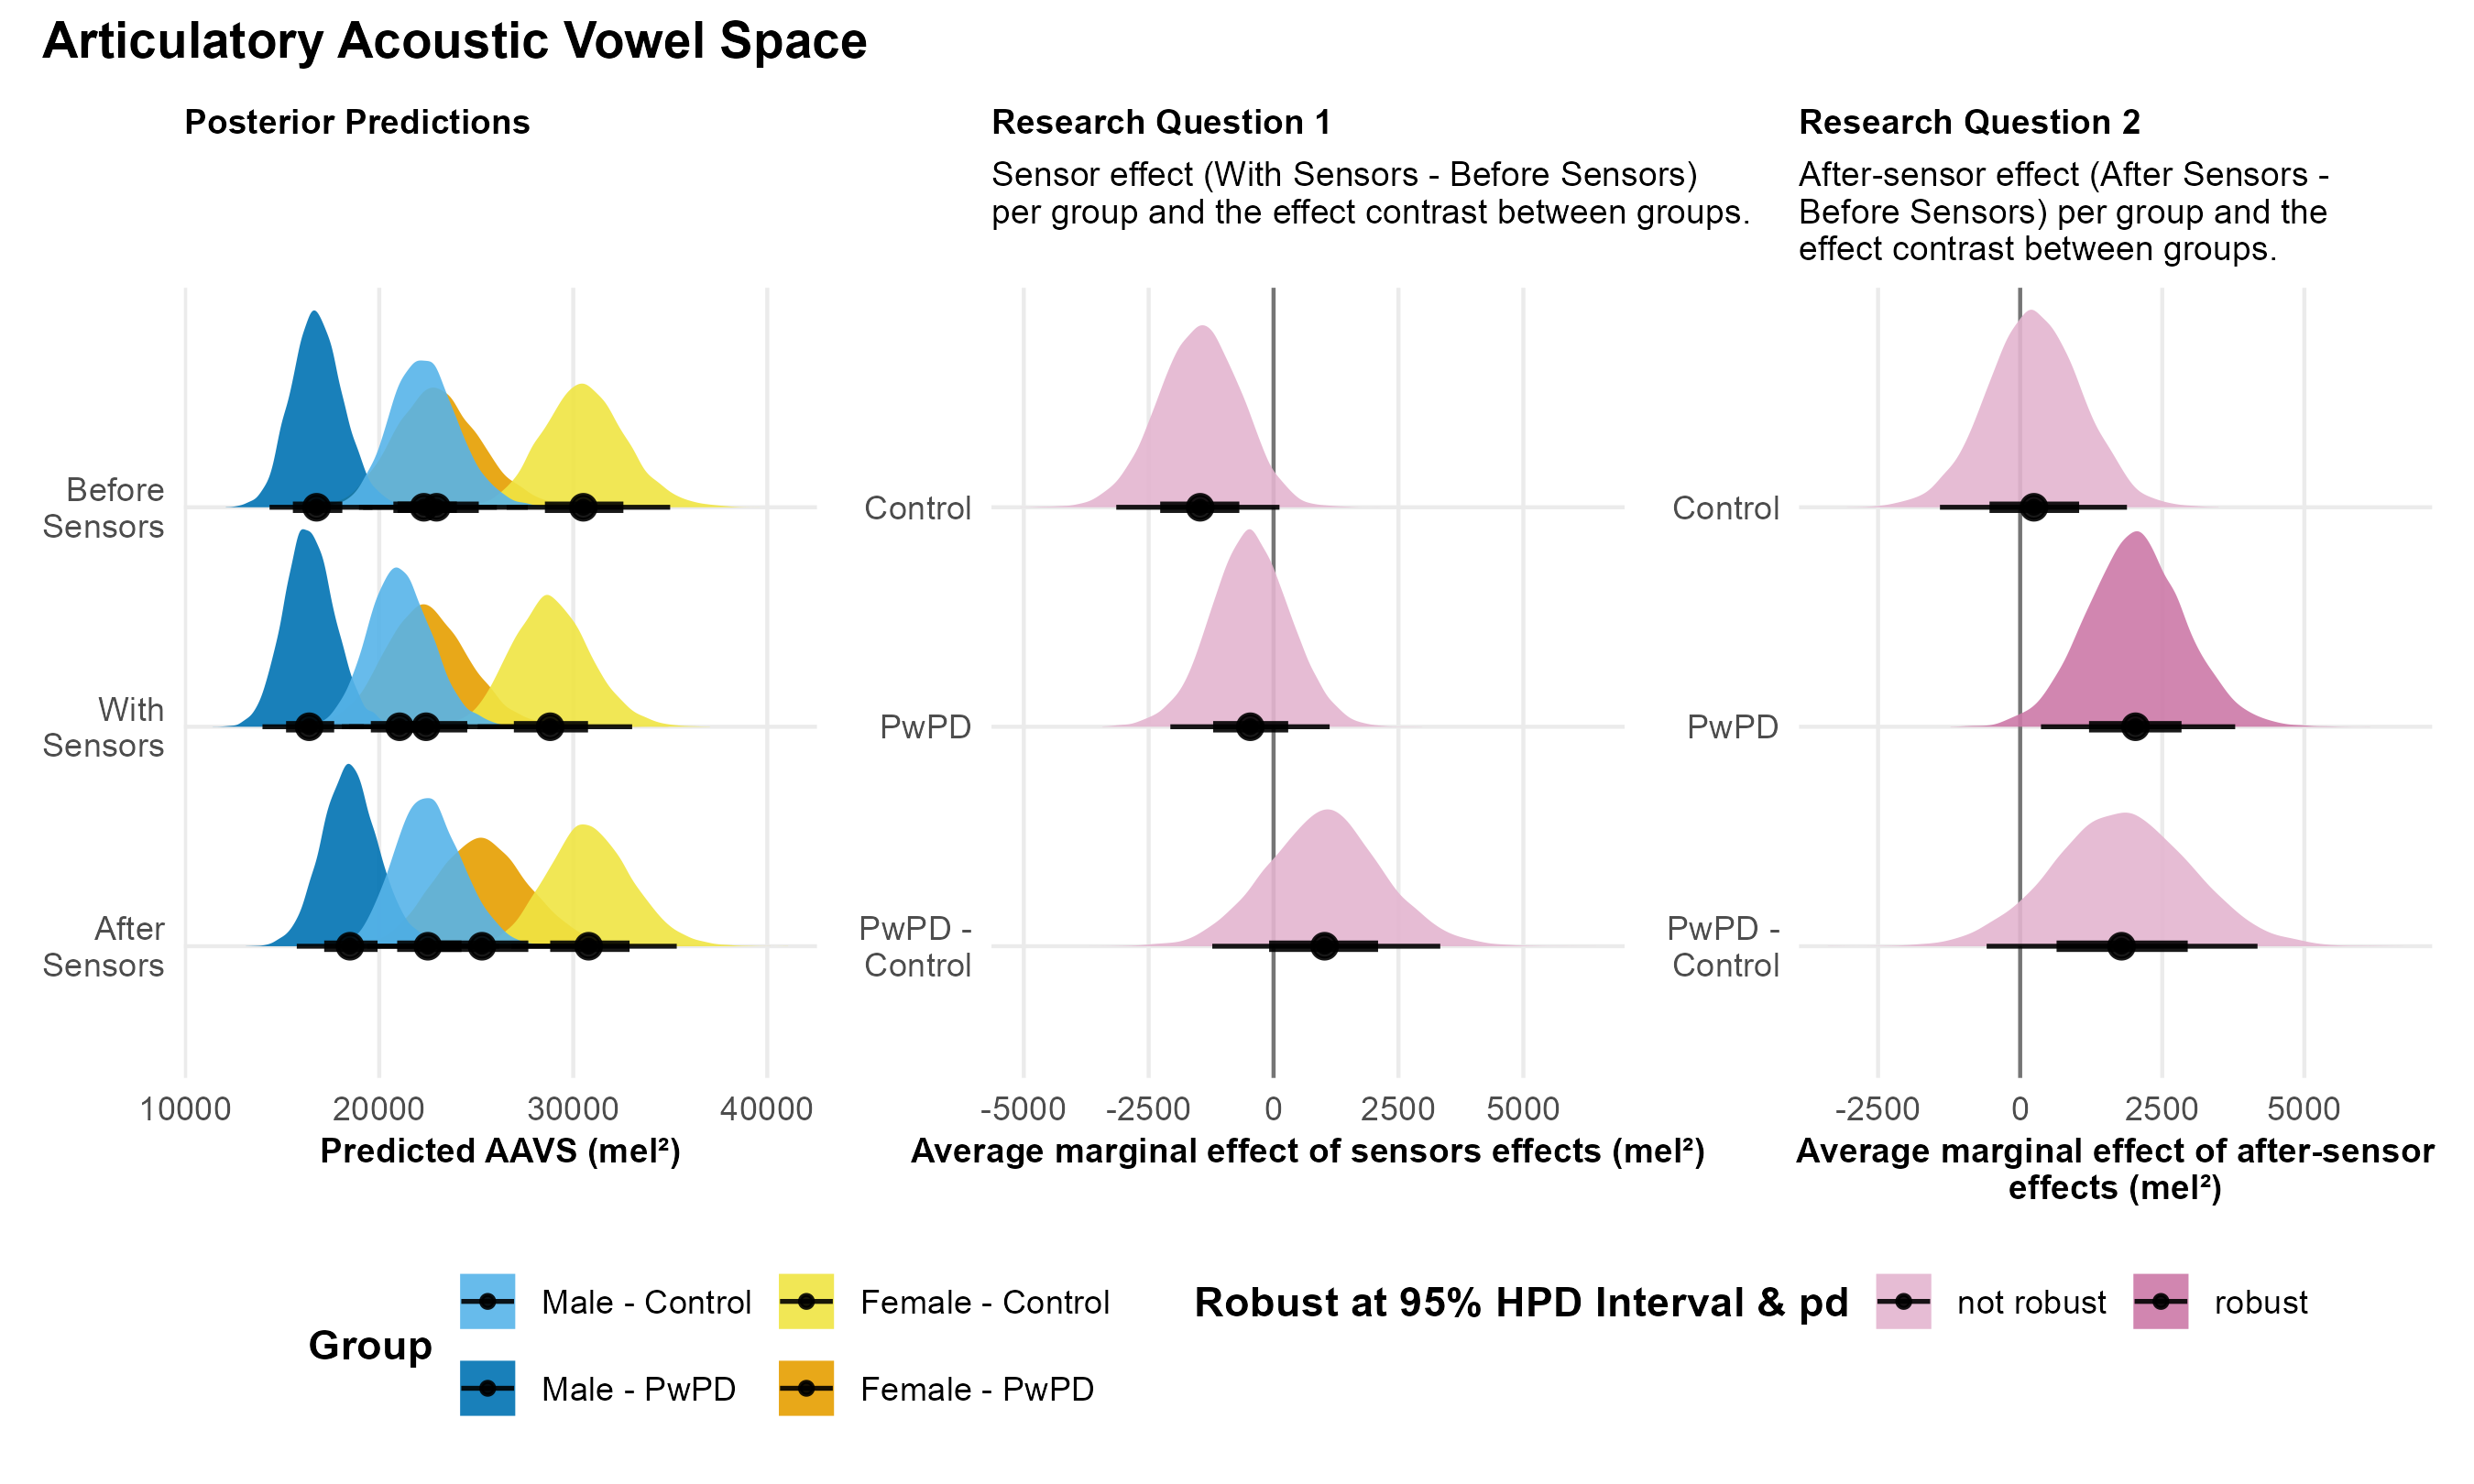
Note. The figure presents posterior predictions for Articulatory Acoustic Vowel Space (AAVS) across speaker sex and group, as well as the main findings for Research Questions 1 and 2.
PwPD = People with Parkinson’s disease; pd = probability of direction.
M1. For /s/, contingent on the data and model, both Control and PwPD speakers showed robust reductions in M1 values when wearing sensors (100% and 98% probabilities, respectively; middle panel of Figure 4). Although there was a high probability of a between-group difference in the magnitude of this reduction (pd = 97%), the 95% HPD interval crossed zero, indicating this difference was not robustly supported. Thus, there remains no clear evidence that Control and PwPD speakers differed substantially in their response to wearing sensors. In contrast, for /ʃ/, neither Control nor PwPD speakers showed robust sensor effects, as indicated by wide 95% HPD intervals crossing zero and low probabilities of direction (89% and 66%, respectively). The between-group difference for /ʃ/ was similarly weak (pd = 67%), providing no evidence that the groups differed meaningfully in their response to wearing sensors.
M2. For /s/, contingent on the data and model, there was a 97% probability that Control speakers had higher M2 values when wearing sensors compared to before sensors, but this effect was not robust due to the 95% HPD interval crossing zero (middle panel of Figure 5). In contrast, PwPD speakers demonstrated a robust increase in M2 values with sensors (100% probability). However, there was no clear evidence that the groups differed in their response to wearing sensors. For /ʃ/, both Control and PwPD speakers showed robust increases in M2 with sensors (99% and 98% probabilities, respectively), and there was no evidence of a between-group difference.
Intelligibility. Contingent on the data and model, both Control and PwPD speakers were perceived as less intelligible when wearing sensors compared to before sensors, with robust effects in each group (99% and 100% probabilities, respectively; middle panel of Figure 6). Notably, the negative impact of sensors on intelligibility was robustly greater for PwPD compared to Control speakers (100% probability).
Naturalness. Contingent on the data and model, both Control and PwPD speakers were perceived as robustly less natural when wearing sensors compared to before sensors (100% probability for both groups; middle panel of Figure 7). However, unlike intelligibility ratings, there was no clear evidence of a between-group difference in the sensor effects for naturalness (pd = 61%).
| Group |
Research Question 1 Sensor Effects (With Sensors - Before Sensors) |
Research Question 2 After-Sensor Effects (After Sensors - Before Sensors) |
||||
|---|---|---|---|---|---|---|
| Estimate1 | 95% HPD | pd | Estimate2 | 95% HPD | pd | |
| Articulation Rate (syl/s) | ||||||
| Control | .14 | .01 – .26 | 98% | .24 | .12 – .37 | 100% |
| PwPD | .06 | -.09 – .22 | 78% | .14 | -.02 – .29 | 96% |
| PwPD - Control | -.07 | -.27 – .13 | 76% | -.11 | -.31 – .10 | 84% |
| Articulatory Acoustic Vowel Space (mel²) | ||||||
| Control | -1470.21 | -3067.72 – 173.77 | 97% | 242.26 | -1393.26 – 1892.32 | 62% |
| PwPD | -465.75 | -1998.62 – 1171.38 | 72% | 2028.89 | 379.05 – 3791.74 | 99% |
| PwPD - Control | 1021.67 | -1286.60 – 3265.16 | 81% | 1783.76 | -679.95 – 4078.83 | 93% |
| M1 for /s/ (kHz) | ||||||
| Control | -.80 | -1.08 – -.53 | 100% | -.16 | -.45 – .10 | 87% |
| PwPD | -.37 | -.73 – -.01 | 98% | .06 | -.29 – .42 | 64% |
| PwPD - Control | .43 | -.03 – .87 | 97% | .22 | -.22 – .67 | 83% |
| M1 for /ʃ/ (kHz) | ||||||
| Control | -.14 | -.37 – .09 | 89% | .14 | -.10 – .35 | 88% |
| PwPD | -.06 | -.35 – .24 | 66% | .22 | -.08 – .51 | 93% |
| PwPD - Control | .08 | -.28 – .47 | 67% | .08 | -.29 – .45 | 67% |
| M2 for /s/ (kHz) | ||||||
| Control | .11 | -.01 – .24 | 97% | .07 | -.05 – .19 | 88% |
| PwPD | .20 | .05 – .35 | 100% | .07 | -.09 – .22 | 80% |
| PwPD - Control | .08 | -.10 – .29 | 81% | -.003 | -.20 – .19 | 51% |
| M2 for /ʃ/ (kHz) | ||||||
| Control | .12 | .03 – .21 | 99% | -.08 | -.17 – .01 | 96% |
| PwPD | .12 | .01 – .24 | 98% | -.03 | -.15 – .08 | 69% |
| PwPD - Control | -.003 | -.15 – .14 | 52% | .05 | -.10 – .19 | 75% |
| Intelligibility (VAS) | ||||||
| Control | -1.25 | -2.43 – -.21 | 99% | .63 | -.20 – 1.60 | 93% |
| PwPD | -5.66 | -8.68 – -3.07 | 100% | -.82 | -2.39 – .67 | 87% |
| PwPD - Control | -4.40 | -7.71 – -1.54 | 100% | -1.48 | -3.30 – .27 | 96% |
| Naturalness (VAS) | ||||||
| Control | -9.86 | -14.23 – -5.63 | 100% | 1.64 | -2.14 – 5.45 | 81% |
| PwPD | -10.78 | -16.87 – -4.71 | 100% | 6.90 | .98 – 12.57 | 99% |
| PwPD - Control | -.97 | -8.62 – 6.43 | 60% | 5.24 | -1.50 – 12.45 | 93% |
| 1 Negative estimates indicate Before Sensors > With Sensors. | ||||||
| 2 Negative estimates indicate Before Sensors > After Sensors. | ||||||
Note. pd = probability of direction
After-Sensor Effects
Our second research question examined after‐sensor effects (i.e., After Sensors – Before Sensors) to understand the impact that wearing EMA sensors for a 45-minute recording session had on various acoustic and perceptual measures in PwPD and Control speakers. Additionally, we were interested in understanding if these effects were comparable between the two groups (i.e., Group × After Sensors – Before Sensors). The findings are presented in the right column of Table 4 and visualized in the right panel of Figures 2-7 for each measure.
Articulation Rate. Contingent on the data and model, Control speakers showed a robust increase in articulation rate following sensor removal compared to before sensors (100% probability), whereas PwPD speakers exhibited a smaller, less certain increase (pd = 96%; HPD crossing zero; right panel of Figure 2). The between-group difference in after-sensor effects was not robust (pd = 84%), indicating no clear evidence that PwPD and Control speakers differed meaningfully in articulation rate following sensor removal.
AAVS. Contingent on the data and model, Control speakers showed no robust difference in AAVS following sensor removal compared to before sensors (right panel of Figure 3). In contrast, there was a 99% probability that PwPD speakers robustly increased their AAVS following sensor removal. However, the between-group difference in these after-sensor effects was not robustly supported (pd = 93%), suggesting no clear evidence that the groups differed meaningfully in their AAVS responses following sensor removal.
Figure 4
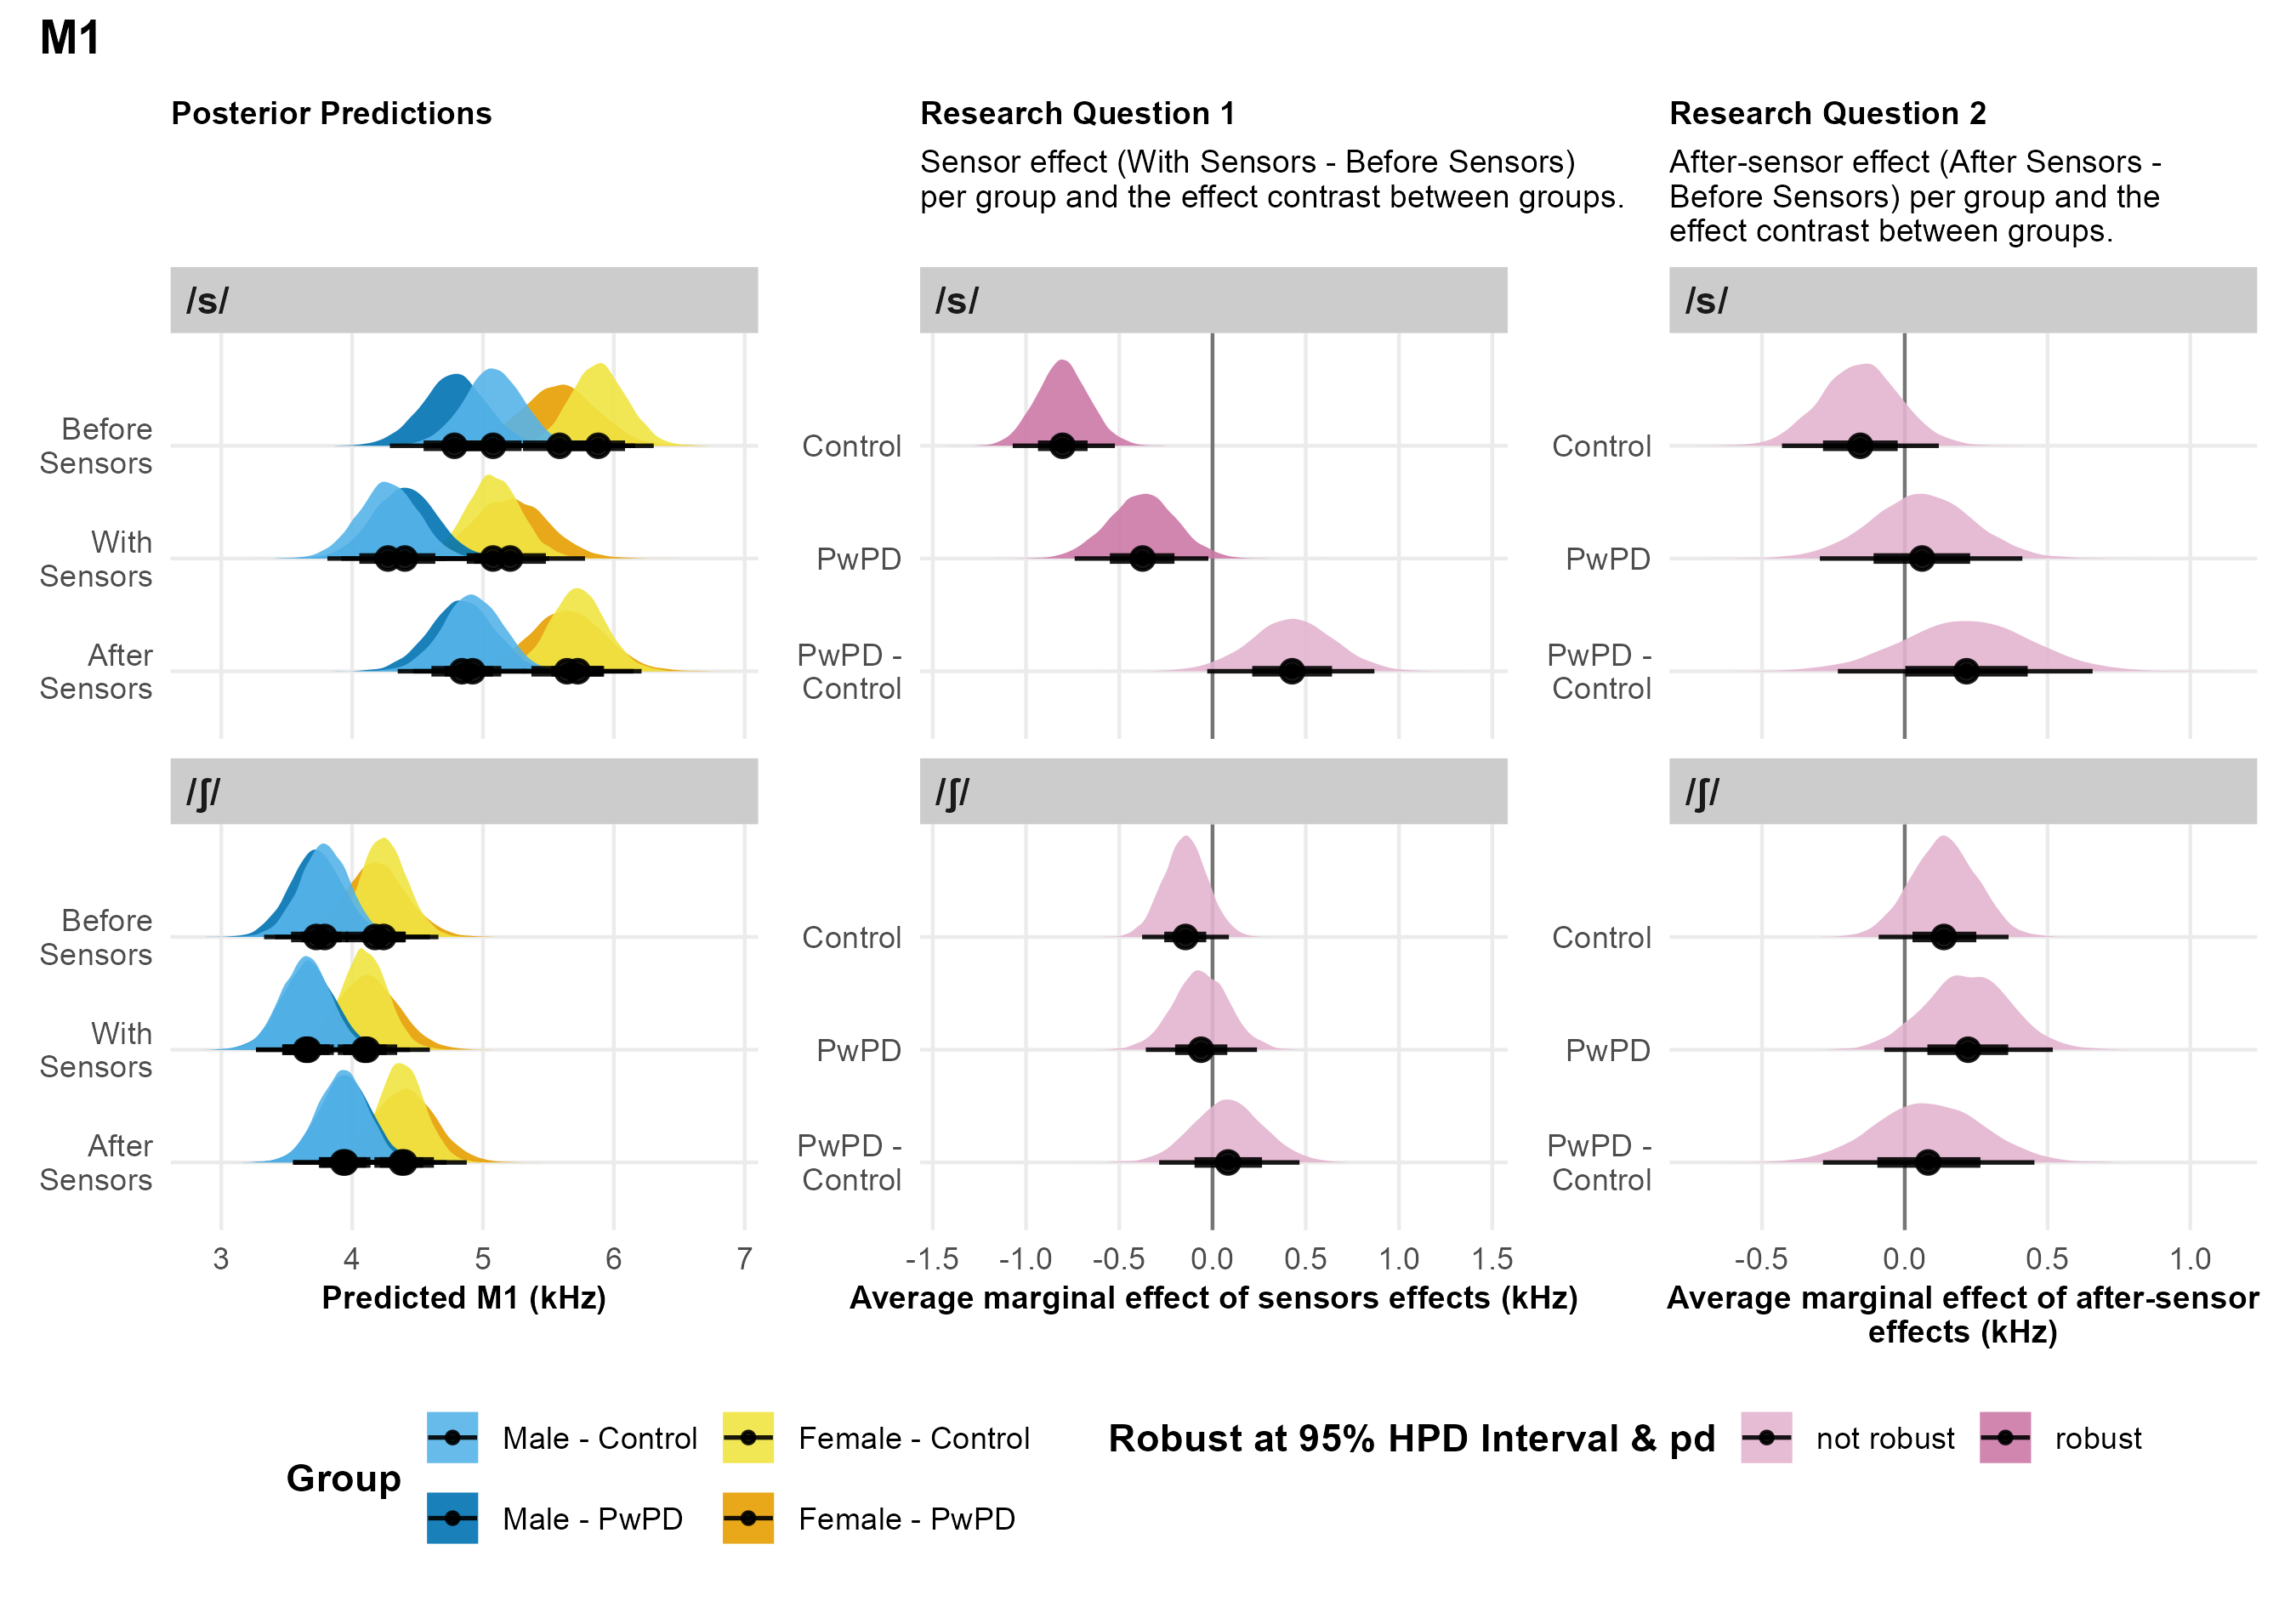
Note. The figure presents posterior predictions for the fricative spectral center of gravity (M1) across consonants, speaker sex and group, as well as the main findings for Research Questions 1 and 2.
PwPD = People with Parkinson’s disease; pd = probability of direction.
Figure 5
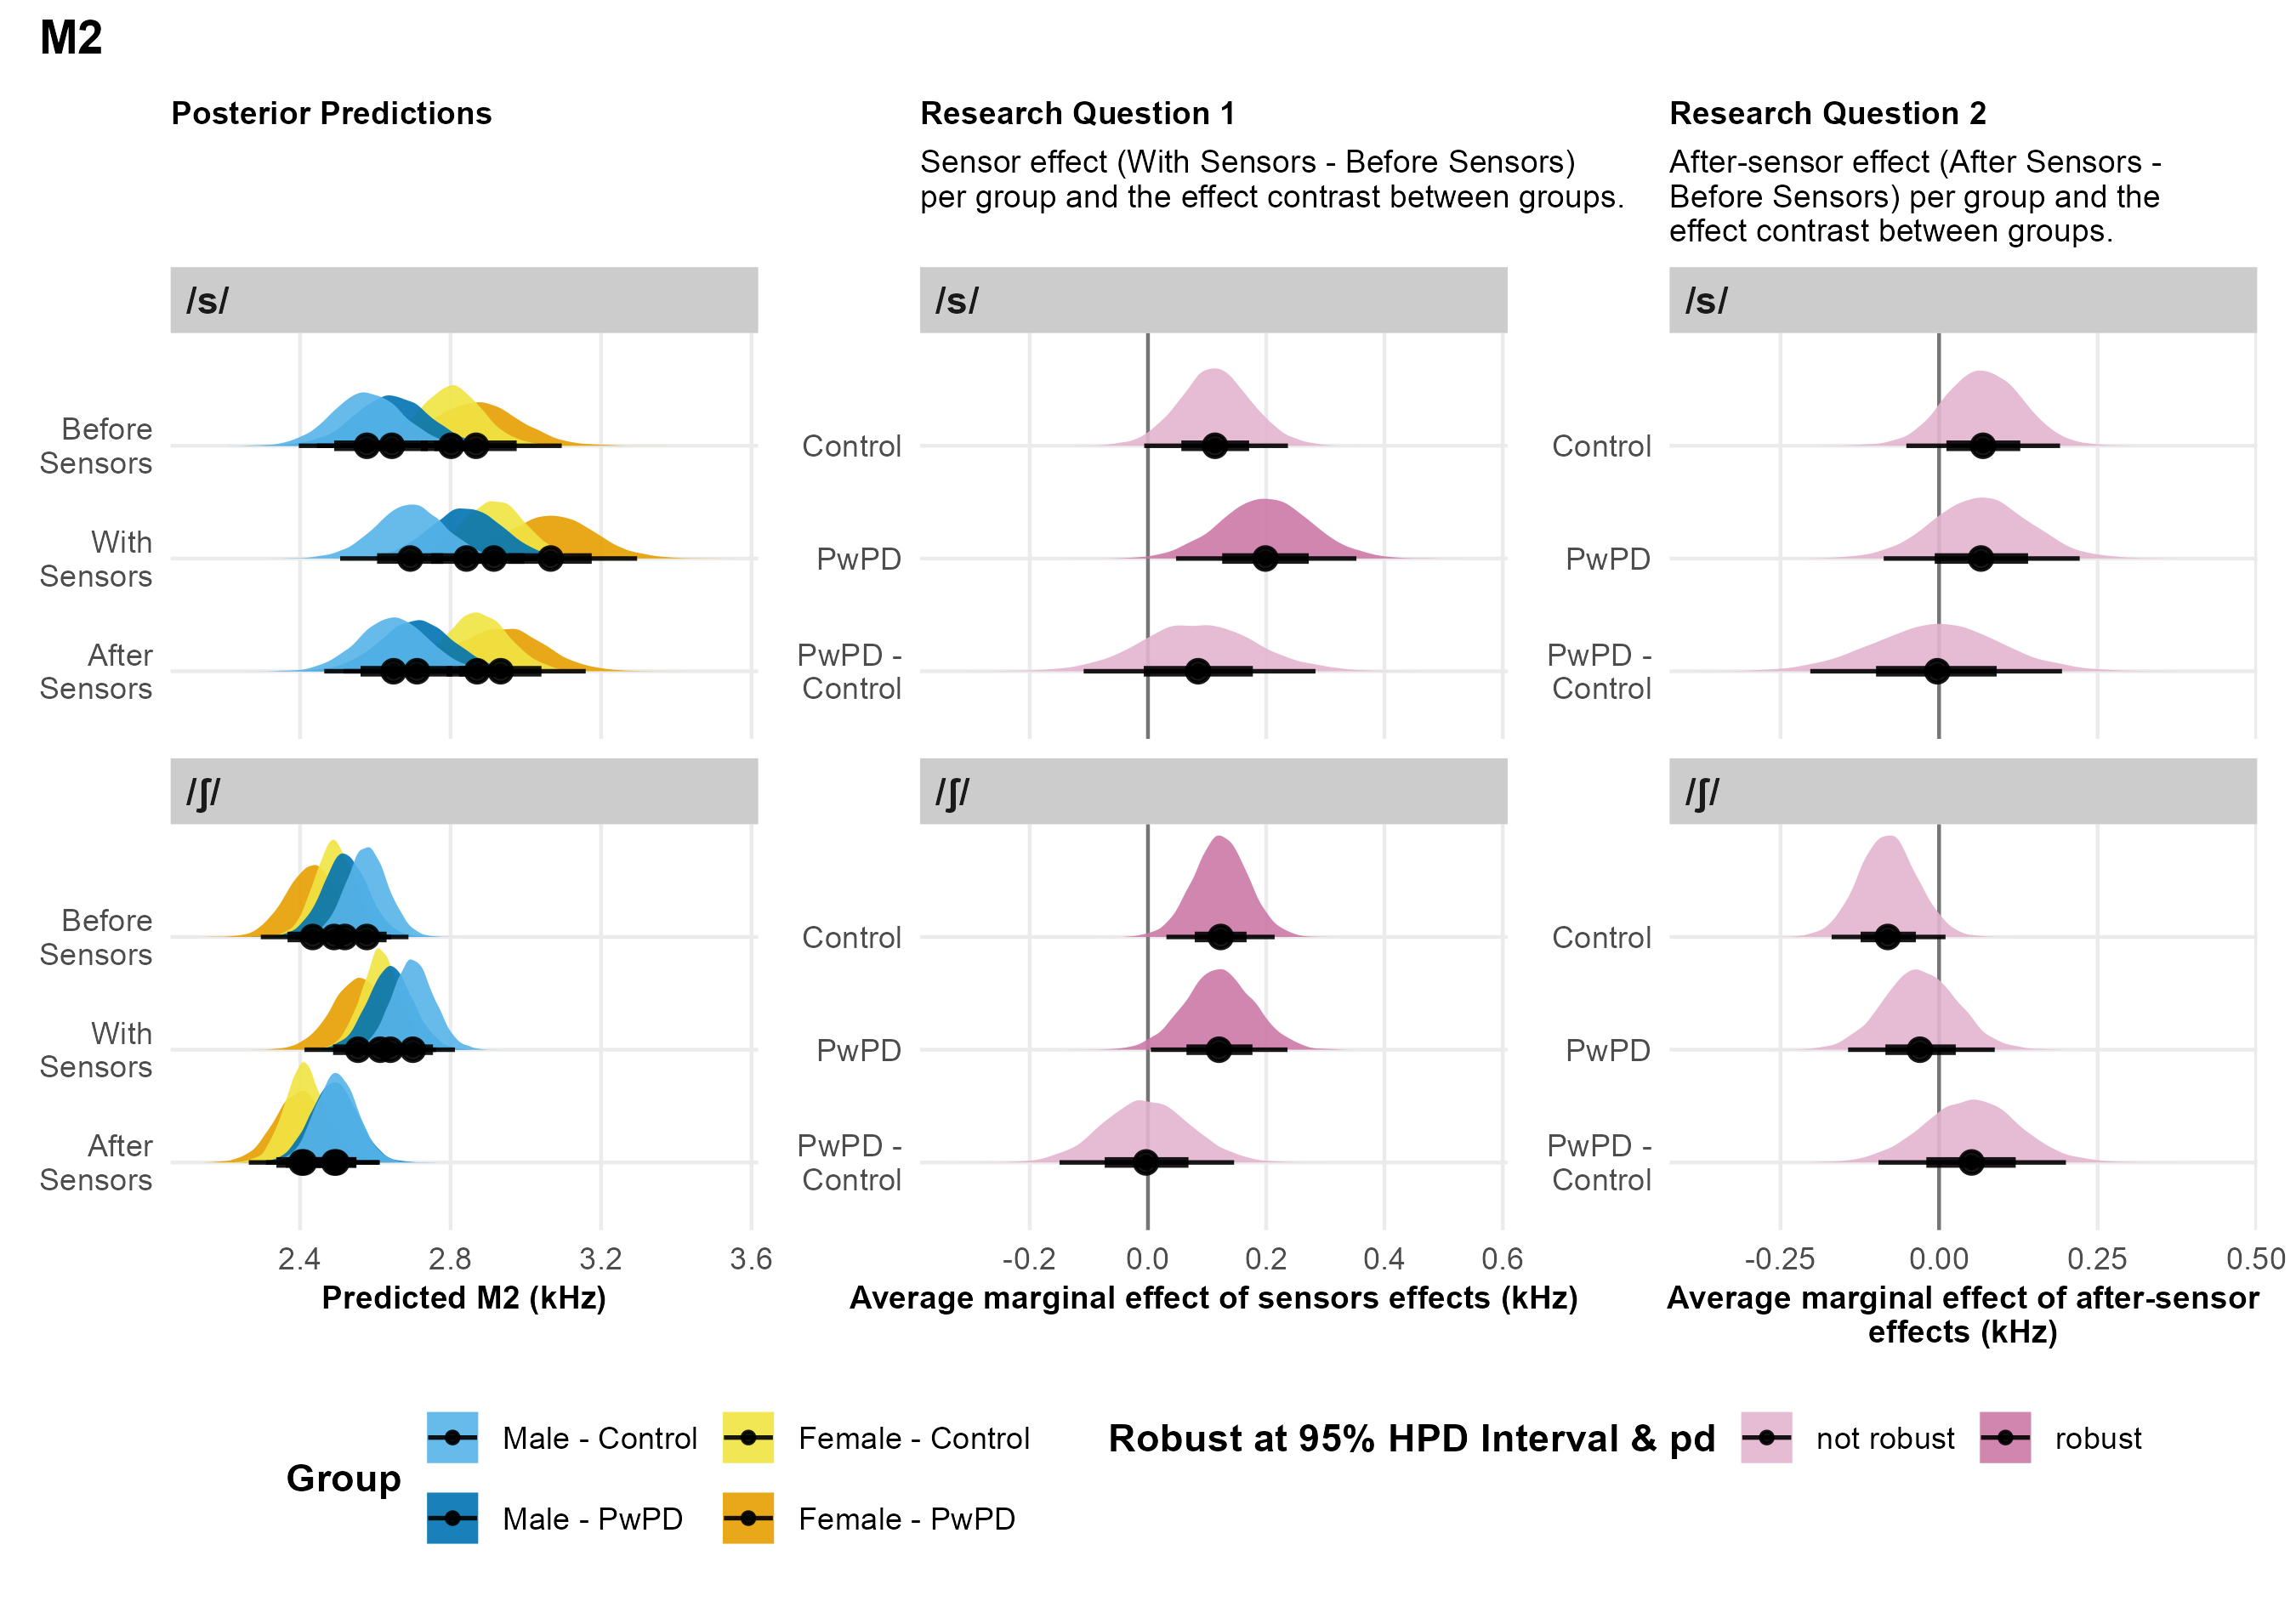
Note. The figure presents posterior predictions for the fricative spectral standard deviation (M2) across consonants, speaker sex and group, as well as the main findings for Research Questions 1 and 2.
M1. For /s/, contingent on the data and model, neither the Control speakers nor PwPD exhibited robust after-sensor effects, and the between-group difference in after-sensor effects was also not robust (right panel of Figure 4). Similarly, for /ʃ/, neither Control speakers nor PwPD showed robust after-sensor effects, and the between-group difference for /ʃ/ after-sensor effects was likewise not robust.
M2. For /s/, contingent on the data and model, neither the Control speakers nor PwPD showed robust after-sensor effects, and the between-group difference in after-sensor effects was similarly not robust (right panel of Figure 5). For /ʃ/, neither Control speakers nor PwPD exhibited robust after-sensor effects, and the between-group difference in after-sensor effects was not robust.
Intelligibility. Contingent on the data and model, there was a 93% probability that Control speakers increased intelligibility ratings following sensor removal compared to before sensors, though this effect was uncertain and not robust (right panel of Figure 6). Similarly, there was an 87% probability that PwPD speakers increased intelligibility ratings following sensor removal, but this effect was also not robustly supported. Furthermore, the between-group difference was not robust (pd = 96%), indicating no clear evidence that PwPD and Control speakers differed meaningfully in their intelligibility after sensor removal.
Naturalness. Contingent on the data and model, Control speakers showed no robust difference in naturalness following sensor removal (pd = 81%; right panel of Figure 7). In contrast, there was a 99% probability that PwPD speakers were perceived as more natural after sensors compared to before sensors, indicating a robust improvement. However, the between-group difference in these after-sensor effects was not robust (pd = 93%), providing no clear evidence that PwPD and Control speakers differed meaningfully in their naturalness ratings following sensor removal.
Figure 6
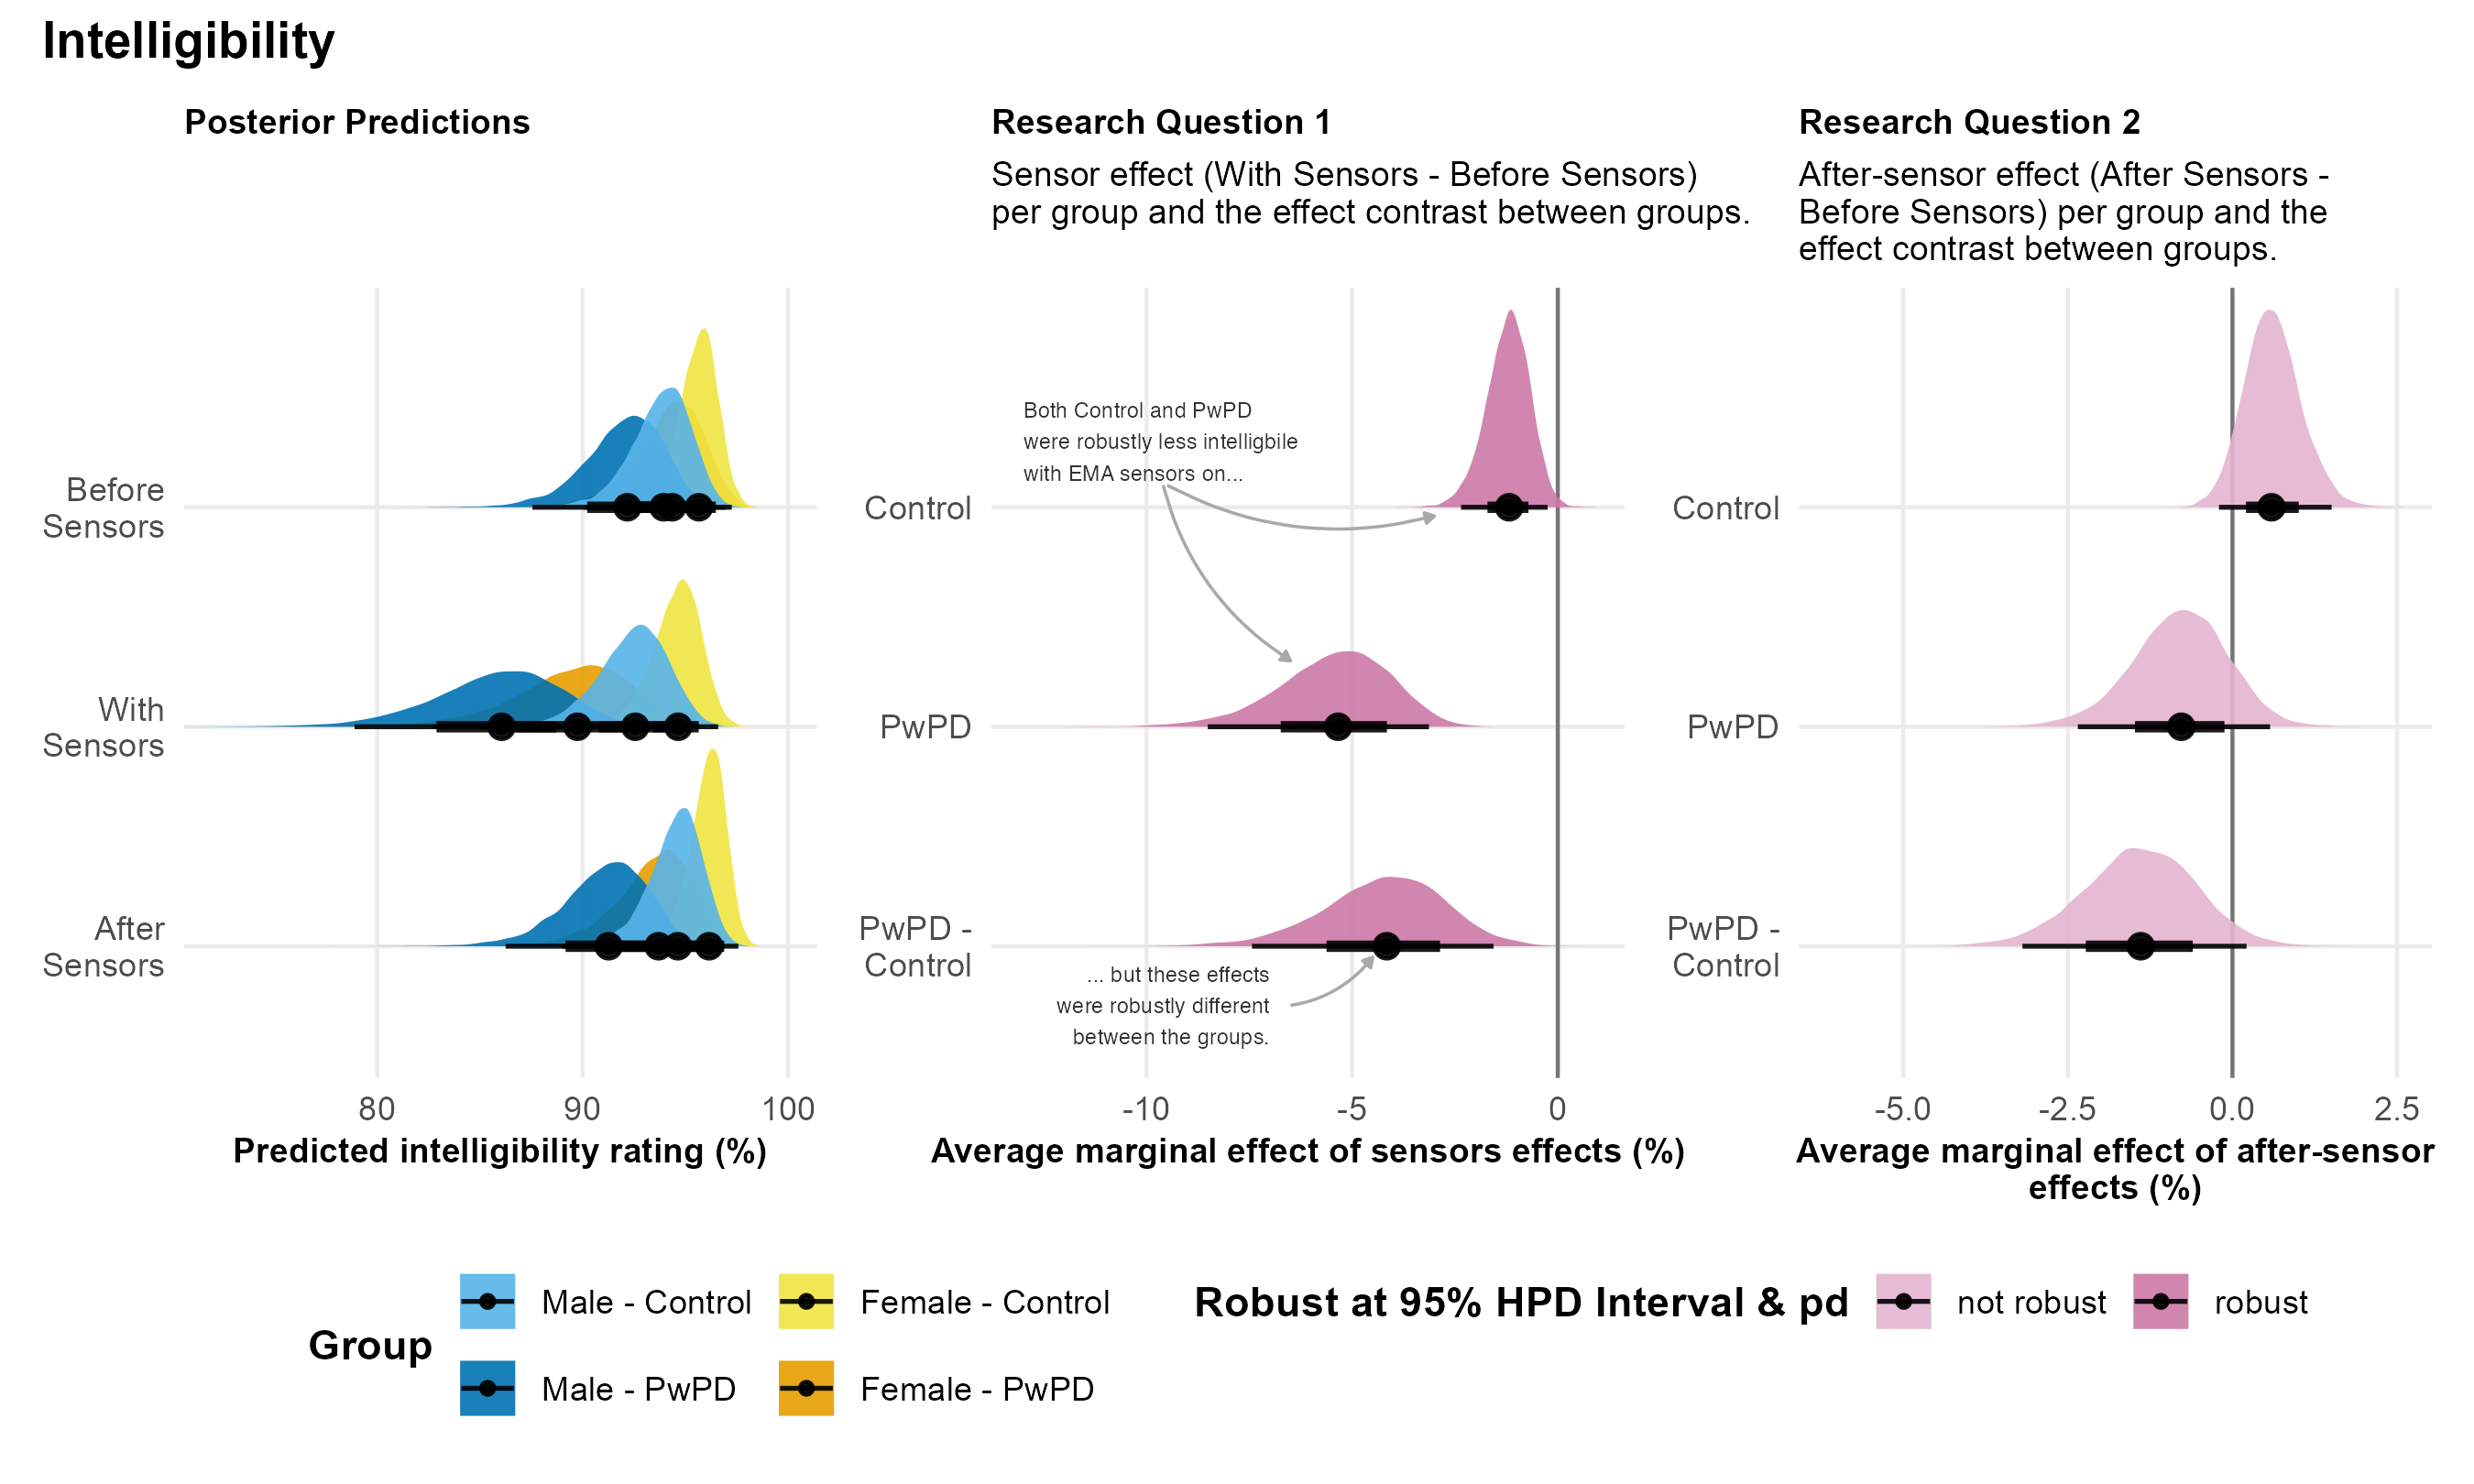
Note. The figure presents posterior predictions for the intelligibility ratings across speaker sex and group, as well as the main findings for Research Questions 1 and 2.
Figure 7
Note. The figure presents posterior predictions for the naturalness ratings across speaker sex and group, as well as the main findings for Research Questions 1 and 2.
Discussion
This study evaluated the impact of EMA sensors on various acoustic and perceptual speech outcomes in PwPD and Control speakers, with an additional goal of determining whether sensor presence affects both groups equally. We also examined after-effects following sensor removal to identify potential carry-over effects, such as continued compensation for the sensors. Three major findings emerged: (1) sensor effects were observed in fricative production and in perceptual ratings of intelligibility and naturalness; (2) after-sensor effects were observed for acoustic working space and ratings of naturalness for PwPD; and (3) sensor and after-sensor effects were largely similar across speaker groups, with the exception of the intelligibility ratings. In the following sections, we contextualize these findings within previous research and discuss their potential implications.
Sensors Effects May Impact Sibilants, Intelligibility, and Naturalness
To examine sensor effects, we explored the contrast between the Before Sensors and With Sensors time points across the various acoustic and perceptual measures. We found meaningful sensor effects for sibilant fricatives and perceptual ratings of intelligibility and naturalness. For articulation rate, Control speakers robustly increased their rate with sensors on, whereas PwPD speakers showed a similar, though less certain and non-robust, effect. However, the posterior predictions in the left panel of Figure 2 reveal that articulation rate increased with each subsequent reading of the passage, regardless of sensor status. This pattern suggests that the increase is more likely due to passage familiarization than to a sensor-induced effect, as even larger increases were observed between the Before Sensors and After Sensors time points when speakers were most familiar with the passage. Thus, we cannot confidently conclude that EMA sensors induce a rate-increasing effect.
For fricatives, both PwPD and Control speakers had reduced M1 values for /s/ with sensors on compared to before sensors, consistent with Dromey et al. (2018). Further, this change was similar for both speaker groups as indicated by non-robust interaction effects. These findings suggest that the presence of the sensors, particularly the tongue front sensor, obstructed the lingual-alveolar constriction required for /s/ production. Specifically, the tongue front sensor, located 2 cm from the tongue tip, likely created a longer front cavity, resulting in a constriction more similar to that of /ʃ/, as reflected by the lower M1 values. However, the increased M2 values for both /s/ and /ʃ/ between Before Sensors and With Sensors are more challenging to interpret. These increased M2 values may be due to the presence of the sensor wires, which might have obstructed the air stream. This could explain why the present study and Dromey et al. (2018) observed sensor effects for M2, while Weismer & Bunton (1999), who used wireless gold pellets, did not. Therefore, researchers should consider the impact that sensors and sensor wires may have on the acoustic signal of lingual fricatives /s/ and /ʃ/ in data collected with EMA sensors.
Our analysis of AAVS did not show robust sensor effects, contrasting with recent findings of a reduced AAVS when sensors are worn (Tienkamp et al., 2024). This discrepancy does not necessarily rule out sensor effects in our data, as Control speakers still had a 96% probability of a reduced AAVS with sensors compared to before sensors. However, because the 95% HPD interval crossed zero, this effect was less certain and not considered robust. Moreover, the probability of a sensor-related reduction in AAVS was only 72% for PwPD, suggesting an even weaker effect in this group.
Several factors may explain why our findings differ from Tienkamp et al. (2024). First, they had a larger sample size, particularly for PwPD, which could increase the power to detect sensor effects. Second, the studies involved different languages. Our participants spoke American English, whereas Tienkamp et al. (2024) examined Dutch speakers. Language-specific characteristics might influence AAVS in ways that complicate direct comparisons. Third, articulation rate increased across subsequent readings in our study, potentially contributing to a more centralized vowel space (Turner et al., 1995; Weismer et al., 2000). In our study, we aimed to control for this by including passage duration as a covariate in our AAVS model. However, although Tienkamp et al. (2024) also employed repeated readings, they did not control for articulation or speech rate, which could have confounded their findings. Further research is needed to clarify how EMA sensors influence working space across various languages and speaking tasks.
In our sample, EMA sensors negatively impacted listener perceptions of speech intelligibility and naturalness in both PwPD and Control speakers. Regarding intelligibility, our findings align with Meenakshi et al. (2014), as both studies found that EMA sensors reduce intelligibility despite differences in measurement approaches. Similarly, while Dromey et al. (2018) did not assess intelligibility or naturalness, their finding of reduced articulatory precision with sensors is consistent with our results. These findings suggest that even after a 10-minute adaptation period, EMA sensors introduce perceptual degradation. Researchers using EMA data for perceptual ratings should consider that intelligibility and naturalness may be affected. Rather than viewing this as a limitation of EMA, we emphasize it as a methodological factor that should be accounted for in study designs. To mitigate these effects, we recommend collecting speech samples for perceptual ratings before applying EMA sensors.
After-Sensor Effects May Impact Articulatory Acoustic Vowel Space and Naturalness Ratings
To examine after-sensor effects, we compared acoustic and perceptual measures between the Before Sensors and After Sensors time points. For most measures, there was no clear evidence of after-sensor effects. For articulation rate, Control speakers robustly increased their rate between the Before Sensors and After Sensors time points, whereas PwPD speakers showed a similar, though less certain and non-robust, effect. However, like the articulation rate findings for sensor effects, this rate increase is likely the result of passage familiarization rather than true after-sensor effects. Future research investigating after-effects should account for such familiarization effects, as they may influence certain speech outcome measures like articulation rate.
In contrast, clear after-sensor effects were observed in PwPD, as indicated by robust changes in AAVS and naturalness ratings. Specifically, AAVS increased by 10.2% between the Before Sensors and After Sensors time points. This suggests that while wearing sensors, PwPD may compensate for sensor-induced perturbations by exaggerating articulatory gestures to maintain their pre-sensor articulatory working space. After sensor removal, these compensatory strategies may persist to some degree, resulting in an enlarged working space.
Additionally, PwPD were rated as 11.08% more natural at the After Sensors time point compared to Before Sensors. This perceptual improvement may be a consequence of the increased AAVS, aligning with Whitfield & Goberman (2014), who found that increased vowel space was associated with improved speech clarity in PwPD. However, after-sensor effects were not observed for intelligibility ratings, suggesting that while the articulatory adjustments led to increased naturalness, they did not meaningfully enhance intelligibility. Taken together, these findings suggest that despite potential auditory and somatosensory deficits, PwPD recognize the impact of EMA sensors on their speech and employ alternative compensatory strategies to mitigate these perturbations. Following sensor removal, PwPD may partially maintain these exaggerated motor plans, resulting in increased AAVS and higher ratings of naturalness.
It remains unclear how long these articulatory and perceptual benefits of after-sensor effects may last. The After Sensors recording was conducted immediately after sensor removal, which took an average of 5.21 minutes. Research in motor control suggests that while returning to baseline function following motor adaptation occurs gradually, the rate of de-adaptation is typically faster than the initial adaptation process (Bastian, 2008; Davidson & Wolpert, 2004). Dromey et al. (2018) found that after a 10-minute adaptation period to EMA sensors, no further perceptual or acoustic improvements were observed. Based on this, it is reasonable to hypothesize that after-sensor effects may not persist beyond 10 minutes. However, future research should systematically investigate the duration of after-sensor effects using methods similar to those employed in Dromey et al. (2018) to assess sensor effects.
Effects Were Similar Across Speaker Groups, Except for Intelligibility
Our study aimed to determine whether sensor effects and after-sensor effects differentially impacted PwPD and Control speakers. To investigate potential group differences, we examined interactions between speaker group and the contrasts of interest (RQ1: With Sensors - Before Sensors × Group; RQ2: After Sensors - Before Sensors × Group). Among all the measures analyzed, the only robust group difference emerged in the sensor effects on intelligibility.
Although both groups experienced reduced intelligibility while wearing sensors, the magnitude of this effect was significantly greater for PwPD. Control speakers showed only a 1.25% decrease in intelligibility ratings with sensors, whereas PwPD experienced a 5.79% decrease. This suggests that PwPD are more susceptible to sensor effects when it comes to intelligibility. Interestingly, PwPD and Control speakers did not differ in how sensors impacted articulatory working space (i.e., AAVS) or fricative production (i.e., M1 & M2). This indicates that, although sensors affect articulation similarly across groups, the perceptual consequences are more pronounced for PwPD. One possible explanation is that the interaction between sensor effects and dysarthria has a compounding impact on intelligibility, amplifying the perceptual deficits already present in PwPD.
The finding that sensor effects for intelligibility ratings were more pronounced for PwPD compared to Control speakers has important methodological implications. Specifically, studies using acoustic data recorded with EMA sensors to obtain perceptual measures should anticipate some degree of perceptual degradation caused by the sensors, particularly for PwPD with hypokinetic dysarthria, who appear to be more affected than neurologically healthy speakers. Researchers should interpret such measurements with caution. Alternatively, to ensure that perceptual judgments reflect dysarthria rather than a combination of dysarthria and sensor effects, researchers could collect speech samples before placing EMA sensors.
Our data did not reveal strong evidence of group differences in sensor effects for M1 in /s/. However, we cannot entirely rule out the possibility of an interaction effect. Specifically, our analysis estimated a 97% probability that Control speakers experienced a greater reduction in M1 values due to sensor placement compared to PwPD. However, the HPD interval crossed zero, making this effect non-robust. While our current data are inconclusive, this pattern may suggest that PwPD are less affected by the somatosensory perturbation introduced by EMA sensors, aligning with prior evidence of somatosensory deficits in PwPD (Chen & Watson, 2017; Hammer & Barlow, 2010; Schneider et al., 1986). Further research with a larger sample size is needed to determine whether PwPD are indeed less impacted by EMA sensors, particularly for M1 values in /s/ production.
Finally, the current study was designed to examine sensor- and after-sensor effects at a group level. However, individual speaker variability within both groups suggests that some individuals may be more sensitive to sensor presence (see individual trend lines in Supplemental Figure 1). This aligns with the conclusion from Lametti et al. (2012) that (at least for neurologically healthy speakers) speakers vary in their weighting of auditory and somatosensory feedback to control speech. Thus, individuals with a stronger reliance on somatosensory feedback may be more perturbed by EMA sensors, which act as somatosensory perturbations. Future research should investigate this individual variability and consider how speakers’ reliance on auditory versus somatosensory feedback may influence their response to EMA sensors.
Limitations and Future Directions
There are a few limitations to note in this study. First, the sample size was modest, and the two groups were not perfectly matched for age and sex. Although statistical controls were applied to account for these differences, future research should aim for more balanced group designs to minimize potential confounding effects.
Second, the methodology for examining after-effects following sensor removal was not tightly controlled. Studies investigating adaptation and de-adaptation effects typically involve continuous observation of the target behavior to track changes over time. However, due to the design of this study, this was not possible. Between the final recording with sensors and the after-sensors time point, participants engaged in the sensor removal process, which included varying levels of verbal interaction with the research team as the sensors and residual dental glue were removed. The duration of this process varied across participants, meaning that the after-sensors recording may have captured different stages of de-adaptation. For this reason, our findings of the after-sensor effects should be interpreted with this in mind.
Finally, a key motivation for this study was to explore how somatosensory deficits in PwPD might influence their ability to compensate for the perturbations introduced by EMA sensors. However, we did not collect direct measures of somatosensory function. Assessing somatosensory abilities could provide a clearer understanding of individual differences in adaptation to EMA sensors. It is reasonable to hypothesize that PwPD with more severe somatosensory deficits may be less capable of adapting to and compensating for EMA sensors.
Conclusion
The purpose of this study was to examine the impact of EMA sensors on speech production and perception in PwPD and Control speakers. By investigating both sensor effects and after-sensor effects, this study aimed to explore the methodological and theoretical implications of using EMA in speech research. The results indicated that EMA sensors primarily affected sibilant fricative production and perceptual ratings of intelligibility and naturalness in both groups. However, PwPD experienced a greater decline in intelligibility ratings when wearing sensors compared to Control speakers. Notably, despite known somatosensory deficits associated with Parkinson’s disease, PwPD in this study employed compensatory strategies in response to the sensors. These strategies persisted for at least five minutes after sensor removal and included an enlarged articulatory working space, which was associated with increased perceptions of naturalness. These findings have important methodological and theoretical implications for interpreting EMA data collected from both PwPD and Control speakers.
References
Abur, D., Lester-Smith, R. A., Daliri, A., Lupiani, A. A., Guenther, F. H., & Stepp, C. E. (2018). Sensorimotor adaptation of voice fundamental frequency in Parkinson’s disease. PLOS ONE, 13(1), e0191839. https://doi.org/10.1371/journal.pone.0191839
Anand, S., & Stepp, C. E. (2015). Listener perception of monopitch, naturalness, and intelligibility for speakers with parkinson’s disease. Journal of Speech, Language, and Hearing Research, 58(4), 1134–1144. https://doi.org/10.1044/2015_JSLHR-S-14-0243
Anwyl-Irvine, A. L., Massonnié, J., Flitton, A., Kirkham, N., & Evershed, J. K. (2020). Gorilla in our midst: An online behavioral experiment builder. Behavior Research Methods, 52(1), 388–407. https://doi.org/10.3758/s13428-019-01237-x
Bang, Y.-I., Min, K., Sohn, Y. H., & Cho, S.-R. (2013). Acoustic characteristics of vowel sounds in patients with Parkinson disease. NeuroRehabilitation, 32(3), 649–654. https://doi.org/10.3233/NRE-130887
Bastian, A. J. (2008). Understanding sensorimotor adaptation and learning for rehabilitation. Current Opinion in Neurology, 21(6), 628–633. https://doi.org/10.1097/WCO.0b013e328315a293
Berry, J. J. (2011). Accuracy of the NDI wave speech research system. Journal of Speech, Language, and Hearing Research, 54(5), 1295–1301. https://doi.org/10.1044/1092-4388(2011/10-0226)
Boersma, P., & Weenink, D. (2021). PRAAT: Doing phonetics by computer.
Bořil, T., & Skarnitzl, R. (2016). Tools rPraat and mPraat (P. Skarnitzl, A. Horák, I. Kopeček, & K. Pala, Eds.; pp. 367–374). Springer International Publishing.
Borrie, S. A., Wynn, C. J., Berisha, V., & Barrett, T. S. (2022). From speech acoustics to communicative participation in dysarthria: Toward a causal framework. Journal of Speech, Language, and Hearing Research, 405–418. https://doi.org/10.1044/2021_JSLHR-21-00306
Brunner, J., & Hoole, P. (2012). Motor equivalent strategies in the production of German /∫/ under perturbation. Language and Speech, 55(4), 457–476. https://doi.org/10.1177/0023830911434098
Buch, E. R., Young, S., & Contreras-Vidal, J. L. (2003). Visuomotor adaptation in normal aging. Learning & Memory, 10(1), 55–63. https://doi.org/10.1101/lm.50303
Bultitude, J. H., Rafal, R. D., & Tinker, C. (2012). Moving forward with prisms: Sensory-motor adaptation improves gait initiation in parkinson’s disease. Frontiers in Neurology, 3. https://doi.org/10.3389/fneur.2012.00132
Bürkner, P.-C. (2018). Advanced Bayesian Multilevel Modeling with the R Package brms. The R Journal, 10(1), 395–411. https://journal.r-project.org/archive/2018/RJ-2018-017/index.html
Carpenter, B., Gelman, A., Hoffman, M. D., Lee, D., Goodrich, B., Betancourt, M., Brubaker, M., Guo, J., Li, P., & Riddell, A. (2017). Stan: A Probabilistic Programming Language. Journal of Statistical Software, 76, 1–32. https://doi.org/10.18637/jss.v076.i01
Chen, Y.-W., & Watson, P. J. (2017). Speech production and sensory impairment in mild parkinson’s disease. The Journal of the Acoustical Society of America, 141(5), 3030–3041. https://doi.org/10.1121/1.4980138
Chu, S. Y., Barlow, S. M., Lee, J., & Wang, J. (2020). Effects of utterance rate and length on the spatiotemporal index in parkinson’s disease. International Journal of Speech-Language Pathology, 22(2), 141151. https://doi.org/10.1080/17549507.2019.1622781
Contreras-Vidal, J. L., & Buch, E. R. (2003). Effects of Parkinson’s disease on visuomotor adaptation. Experimental Brain Research, 150(1), 25–32. https://doi.org/10.1007/s00221-003-1403-y
Darley, F. L., Aronson, A. E., & Brown, J. R. (1969a). Differential diagnostic patterns of dysarthria. Journal of Speech and Hearing Research, 12(2), 246–269. https://doi.org/10.1044/jshr.1202.246
Darley, F. L., Aronson, A. E., & Brown, J. R. (1969b). Clusters of deviant speech dimensions in the dysarthrias. Journal of Speech and Hearing Research, 12(3), 462–496. https://doi.org/10.1044/jshr.1203.462
Davidson, P. R., & Wolpert, D. M. (2004). Scaling down motor memories: De-adaptation after motor learning. Neuroscience Letters, 370(2-3), 102–107. https://doi.org/10.1016/j.neulet.2004.08.003
De Bodt, M. S., Hernández-Díaz Huici, M. E., & Van De Heyning, P. H. (2002). Intelligibility as a linear combination of dimensions in dysarthric speech. Journal of Communication Disorders, 35(3), 283–292. https://doi.org/10.1016/S0021-9924(02)00065-5
Dromey, C., Hunter, E., & Nissen, S. L. (2018). Speech adaptation to kinematic recording sensors: Perceptual and acoustic findings. Journal of Speech, Language, and Hearing Research, 61(3), 593–603. https://doi.org/10.1044/2017_JSLHR-S-17-0169
Duffy, J. R. (2020). Motor speech disorders: Substrates, differential diagnosis, and management (4th ed.). Elsevier.
Forrest, K., Weismer, G., Milenkovic, P., & Dougall, R. N. (1988). Statistical analysis of word-initial voiceless obstruents: Preliminary data. The Journal of the Acoustical Society of America, 84(1), 115–123. https://doi.org/10.1121/1.396977
Hamlet, S. L., & Stone, M. (1976). Compensatory vowel characteristics resulting from the presence of different types of experimental dental prostheses. Journal of Phonetics, 4(3), 199–218. https://doi.org/10.1016/S0095-4470(19)31244-6
Hammer, M. J., & Barlow, S. M. (2010). Laryngeal somatosensory deficits in Parkinson’s disease: implications for speech respiratory and phonatory control. Experimental Brain Research, 201(3), 401–409. https://doi.org/10.1007/s00221-009-2048-2
Hardcastle, W. J., Gibbon, F. E., & Jones, W. (1991). Visual display of tongue-palate contact: Electropalatography in the assessment and remediation of speech disorders. British Journal of Disorders of Communication, 26(1), 4174. https://doi.org/10.3109/13682829109011992
Ho, A. K., Iansek, R., Marigliani, C., Bradshaw, J. L., & Gates, S. (1999). Speech impairment in a large sample of patients with Parkinson’s disease. Behavioural Neurology, 11(3), 327643. https://doi.org/10.1155/1999/327643
Hughes, O. M., & Abbs, J. H. (1976). Labial-mandibular coordination in the production of speech: implications for the operation of motor equivalence. Phonetica, 33(3), 199–221. https://doi.org/10.1159/000259722
Hustad, K. C., Oakes, A., & Allison, K. (2015). Variability and diagnostic accuracy of speech intelligibility scores in children. Journal of Speech, Language, and Hearing Research, 58(6), 1695–1707. https://doi.org/10.1044/2015_JSLHR-S-14-0365
Jongman, A., Wayland, R., & Wong, S. (2000). Acoustic characteristics of english fricatives. The Journal of the Acoustical Society of America, 108(3), 1252–1263. https://doi.org/10.1121/1.1288413
Katz, W. F., Bharadwaj, S. V., & Stettler, M. P. (2006). Influences of electromagnetic articulography sensors on speech produced by healthy adults and individuals with aphasia and apraxia. Journal of Speech, Language, and Hearing Research, 49(3), 645–659. https://doi.org/10.1044/1092-4388(2006/047)
Kearney, E., Giles, R., Haworth, B., Faloutsos, P., Baljko, M., & Yunusova, Y. (2017). Sentence-level movements in parkinson’s disease: Loud, clear, and slow speech. Journal of Speech, Language, and Hearing Research, 60(12), 3426–3440. https://doi.org/10.1044/2017_JSLHR-S-17-0075
Kim, Y., Kent, R. D., & Thompson, A. (2024). Instrumental analysis of articulation (M. J. Ball, N. Müller, & E. Spencer, Eds.; 2nd ed., pp. 505–522). John Wiley & Sons.
Klein, H. B., McAllister, B. T., Davidson, L., & Grigos, M. I. (2013). A multidimensional investigation of children’s /r/ productions: Perceptual, ultrasound, and acoustic measures. American Journal of Speech-Language Pathology, 22(3), 540–553. https://doi.org/10.1044/1058-0360(2013/12-0137)
Koenig, L. L., Shadle, C. H., Preston, J. L., & Mooshammer, C. R. (2013). Toward improved spectral measures of /s/: Results from adolescents. Journal of Speech, Language, and Hearing Research, 56(4), 1175–1189. https://doi.org/10.1044/1092-4388(2012/12-0038)
Lam, J., & Tjaden, K. (2016). Clear speech variants: An acoustic study in parkinson’s disease. J Speech Lang Hear Res, 59(4), 631–646. https://doi.org/10.1044/2015_JSLHR-S-15-0216
Lametti, D. R., Nasir, S. M., & Ostry, D. J. (2012). Sensory preference in speech production revealed by simultaneous alteration of auditory and somatosensory feedback. Journal of Neuroscience, 32(27), 9351–9358. https://doi.org/10.1523/JNEUROSCI.0404-12.2012
Lee, J., Littlejohn, M. A., & Simmons, Z. (2017). Acoustic and tongue kinematic vowel space in speakers with and without dysarthria. Int J Speech Lang Pathol, 19(2), 195–204. https://doi.org/10.1080/17549507.2016.1193899
Length, R. (2023). Emmeans: Estimated marginal means, aka least-squares means. https://CRAN.R-project.org/package=emmeans.
Martin, T. A., Keating, J. G., Goodkin, H. P., Bastian, A. J., & Thach, W. T. (1996). Throwing while looking through prisms: II. Specificity and storage of multiple gazethrow calibrations. Brain, 119(4), 1199–1211. https://doi.org/10.1093/brain/119.4.1199
Masapollo, M., & Nittrouer, S. (2023). Interarticulator speech coordination: timing is of the essence. Journal of Speech, Language, and Hearing Research, 66(3), 901–915. https://doi.org/10.1044/2022_JSLHR-22-00594
McAuliffe, M. J., Ward, E. C., & Murdoch, B. E. (2006a). Speech production in parkinson’s disease: I. An electropalatographic investigation of tongue-palate contact patterns. Clinical Linguistics & Phonetics, 20(1), 1–18. https://doi.org/10.1080/02699200400001044
McAuliffe, M. J., Ward, E. C., & Murdoch, B. E. (2006b). Speech production in parkinson’s disease: II. Acoustic and electropalatographic investigation of sentence, word and segment durations. Clinical Linguistics & Phonetics, 20(1), 19–33. https://doi.org/10.1080/0269-9200400001069
McRae, P. A., Tjaden, K., & Schoonings, B. (2002). Acoustic and perceptual consequences of articulatory rate change in parkinson disease. Journal of Speech, Language, and Hearing Research, 45(1), 35–50. https://doi.org/10.1044/1092-4388(2002/003)
Meenakshi, N., Yarra, C., Yamini, B. K., & Ghosh, P. K. (2014). Interspeech 2014. 935–939. https://doi.org/10.21437/Interspeech.2014-243
Mefferd, A. S. (2015). Articulatory-to-acoustic relations in talkers with dysarthria: A first analysis. Journal of Speech, Language, and Hearing Research, 58(3), 576–589. https://doi.org/10.1044/2015_JSLHR-S-14-0188
Mefferd, A. S., & Dietrich, M. S. (2019). Tongue- and jaw-specific articulatory underpinnings of reduced and enhanced acoustic vowel contrast in talkers with parkinson’s disease. Journal of Speech, Language, and Hearing Research, 62(7), 2118–2132. https://doi.org/10.1044/2019_JSLHR-S-MSC18-18-0192
Miller, H. E., Kearney, E., Nieto, -C. A., Falsini, R., Abur, D., Acosta, A., Chao, S.-C., Dahl, K. L., Franken, M., Heller, M. E. S., Mollaei, F., Niziolek, C. A., Parrell, B., Perrachione, T., Smith, D. J., Stepp, C. E., Tomassi, N., & Guenther, F. H. (2023). Do not cut off your tail: A mega-analysis of responses to auditory perturbation experiments. Journal of Speech, Language, and Hearing Research, 66(11), 4315–4331. https://doi.org/10.1044/2023_JSLHR-23-00315
Mollaei, F., Shiller, D. M., Baum, S. R., & Gracco, V. L. (2016). Sensorimotor control of vocal pitch and formant frequencies in parkinson’s disease. Brain Research, 1646, 269–277. https://doi.org/10.1016/j.brainres.2016.06.013
Mollaei, F., Shiller, D. M., & Gracco, V. L. (2013). Sensorimotor adaptation of speech in Parkinson’s disease. Movement Disorders, 28(12), 1668–1674. https://doi.org/10.1002/mds.25588
Moya-Galé, G., & Levy, E. S. (2019). Parkinson’s disease-associated dysarthria: Prevalence, impact and management strategies. Research and Reviews in Parkinsonism, Volume 9, 9–16. https://doi.org/10.2147/jprls.S168090
Nalborczyk, L., Batailler, C., L, œvenbruck H., Vilain, A., & B, ürkner P.-C. (2019). An introduction to bayesian multilevel models using brms: A case study of gender effects on vowel variability in standard indonesian. Journal of Speech, Language, and Hearing Research, 62(5), 1225–1242. https://doi.org/10.1044/2018_JSLHR-S-18-0006
Nasir, S. M., & Ostry, D. J. (2006). Somatosensory precision in speech production. Current Biology, 16(19), 1918–1923. https://doi.org/10.1016/j.cub.2006.07.069
NDI. (n.d.). Wave system (NDI, canada). Northern Digital Inc.
Patel, R., Connaghan, K., Franco, D., Edsall, E., Forgit, D., Olsen, L., Ramage, L., Tyler, E., & Russell, S. (2013). "The caterpillar": A novel reading passage for assessment of motor speech disorders. Am J Speech Lang Pathol, 22(1), 1–9. https://doi.org/10.1044/1058-0360(2012/11-0134)
Perkell, J. S., Matthies, M. L., Svirsky, M. A., & Jordan, M. I. (1993). Trading relations between tongue-body raising and lip rounding in production of the vowel /u/: A pilot ‘‘motor equivalence’’ study. The Journal of the Acoustical Society of America, 93(5), 2948–2961. https://doi.org/10.1121/1.405814
Perrier, P., & Fuchs, S. (2015). Motor equivalence in speech production (pp. 223–247). John Wiley & Sons, Ltd. https://doi.org/10.1002/9781118584156.ch11
Petrović, B. T. (2020). Spectral moments of fricative consonants in serbian (an account of female speakers’ production). Филолог Часопис За Језик, Књижевност и Културу, 21, 95–133. https://www.ceeol.com/search/article-detail?id=888874
Plowman-Prine, E. K., Okun, M. S., Sapienza, C. M., Shrivastav, R., Fernandez, H. H., Foote, K. D., Ellis, C., Rodriguez, A. D., Burkhead, L. M., & Rosenbek, J. C. (2009). Perceptual characteristics of Parkinsonian speech: A comparison of the pharmacological effects of levodopa across speech and non-speech motor systems. NeuroRehabilitation, 24(2), 131–144. https://doi.org/10.3233/NRE-2009-0462
Purcell, D. W., & Munhall, K. G. (2006). Adaptive control of vowel formant frequency: Evidence from real-time formant manipulation. The Journal of the Acoustical Society of America, 120(2), 966–977. https://doi.org/10.1121/1.2217714
R Core Team. (2023). R: A language and environment for statistical computing. R Foundation for Statistical Computing. https://www.R-project.org/
Rebernik, T., Jacobi, J., Jonkers, R., Noiray, A., & Wieling, M. (2021). A review of data collection practices using electromagnetic articulography. Laboratory Phonology, 12(1). https://doi.org/10.5334/labphon.237
Roemmich, R. T., Nocera, J. R., Stegemöller, E. L., Hassan, A., Okun, M. S., & Hass, C. J. (2014). Locomotor adaptation and locomotor adaptive learning in parkinson’s disease and normal aging. Clinical Neurophysiology : Official Journal of the International Federation of Clinical Neurophysiology, 125(2), 313–319. https://doi.org/10.1016/j.clinph.2013.07.003
Rong, P., Loucks, T., Kim, H., & Hasegawa-Johnson, M. (2012). Relationship between kinematics, F2 slope and speech intelligibility in dysarthria due to cerebral palsy. Clinical Linguistics & Phonetics, 26(9), 806822. https://doi.org/10.3109/02699206.2012.706686
Savariaux, C., Badin, P., Samson, A., & Gerber, S. (2017). A comparative study of the precision of carstens and northern digital instruments electromagnetic articulographs. Journal of Speech, Language, and Hearing Research, 60(2), 322–340. https://doi.org/10.1044/2016_JSLHR-S-15-0223
Schneider, J. S., Diamond, S. G., & Markham, C. H. (1986). Deficits in orofacial sensorimotor function in Parkinson’s disease. Annals of Neurology, 19(3), 275–282. https://doi.org/10.1002/ana.410190309
Sorrento, G. U., Archambault, P. S., & Fung, J. (2018). Adaptation and post-adaptation effects of haptic forces on locomotion in healthy young adults. Journal of NeuroEngineering and Rehabilitation, 15(1), 20. https://doi.org/10.1186/s12984-018-0364-0
Spencer, K. A., Friedlander, C., & Brown, K. A. (2020). Predictors of health-related quality of life and communicative participation in individuals with dysarthria from parkinson’s disease. International Journal of Neurodegenerative Disorders, 3(1), 1–7. https://doi.org/10.23937/2643-4539/1710014
Teplansky, K. J., Wisler, A., Goffman, L., & Wang, J. (2023). The impact of stimulus length in tongue and lip movement pattern stability in amyotrophic lateral sclerosis. Journal of Speech, Language, and Hearing Research. https://doi.org/10.1044/2023_JSLHR-23-00079
Thompson, A., & Kim, Y. (2024). Acoustic and kinematic predictors of intelligibility and articulatory precision in parkinson’s disease. Journal of Speech, Language, and Hearing Research, 67(10), 3595–3611. https://doi.org/10.1044/2024_JSLHR-24-00153
Tienkamp, T. B., Rebernik, T., Jacobi, J., Wieling, M., & Abur, D. (2024). ISSP 2024 - 13th International Seminar on Speech Production. 91–94. https://doi.org/10.21437/issp.2024-24
Tjaden, K., Kain, A., & Lam, J. (2014). Hybridizing conversational and clear speech to investigate the source of increased intelligibility in speakers with parkinson’s disease. Journal of Speech, Language, and Hearing Research, 57(4), 1191–1205. https://doi.org/10.1044/2014_JSLHR-S-13-0086
Tjaden, K., Lam, J., & Wilding, G. (2013). Vowel acoustics in parkinson’s disease and multiple sclerosis: Comparison of clear, loud, and slow speaking conditions. Journal of Speech, Language, and Hearing Research, 56(5), 1485–1502. https://doi.org/10.1044/1092-4388(2013/12-0259)
Tjaden, K., & Wilding, G. E. (2004). Rate and loudness manipulations in dysarthria: Acoustic and perceptual findings. Journal of Speech, Language, and Hearing Research, 47(4), 766–783. https://doi.org/10.1044/1092-4388(2004/058)
Tremblay, S., Shiller, D. M., & Ostry, D. J. (2003). Somatosensory basis of speech production. Nature, 423(6942), 866–869. https://doi.org/10.1038/nature01710
Turner, G. S., Tjaden, K., & Weismer, G. (1995). The influence of speaking rate on vowel space and speech intelligibility for individuals with amyotrophic lateral sclerosis. Journal of Speech, Language, and Hearing Research, 38(5), 1001–1013. https://doi.org/10.1044/jshr.3805.1001
Villacorta, V. M., Perkell, J. S., & Guenther, F. H. (2007). Sensorimotor adaptation to feedback perturbations of vowel acoustics and its relation to perception. The Journal of the Acoustical Society of America, 122(4), 2306–2319. https://doi.org/10.1121/1.2773966
Weismer, G., & Bunton, K. (1999). Influences of pellet markers on speech production behavior: Acoustical and perceptual measures. The Journal of the Acoustical Society of America, 105(5), 2882–2894. https://doi.org/10.1121/1.426902
Weismer, G., Jeng, J.-Y., Laures, J. S., Kent, R. D., & Kent, J. F. (2001). Acoustic and intelligibility characteristics of sentence production in neurogenic speech disorders. Folia Phoniatrica Et Logopaedica, 53(1), 1–18. https://doi.org/10.1159/000052649
Weismer, G., Laures, J. S., Jeng, J. Y., Kent, R. D., & Kent, J. F. (2000). Effect of speaking rate manipulations on acoustic and perceptual aspects of the dysarthria in amyotrophic lateral sclerosis. Folia Phoniatr Logop, 52(5), 201–219. https://doi.org/10.1159/000021536
Whitfield, J. A., & Goberman, A. M. (2014). Articulatoryacoustic vowel space: Application to clear speech in individuals with Parkinson’s disease. Journal of Communication Disorders, 51, 19–28. https://doi.org/10.1016/j.jcomdis.2014.06.005
Whitfield, J. A., & Mehta, D. D. (2019). Examination of clear speech in parkinson disease using measures of working vowel space. Journal of Speech, Language, and Hearing Research, 62(7), 2082–2098. https://doi.org/10.1044/2019_JSLHR-S-MSC18-18-0189
Supplemental Information
Figures
Figure S1
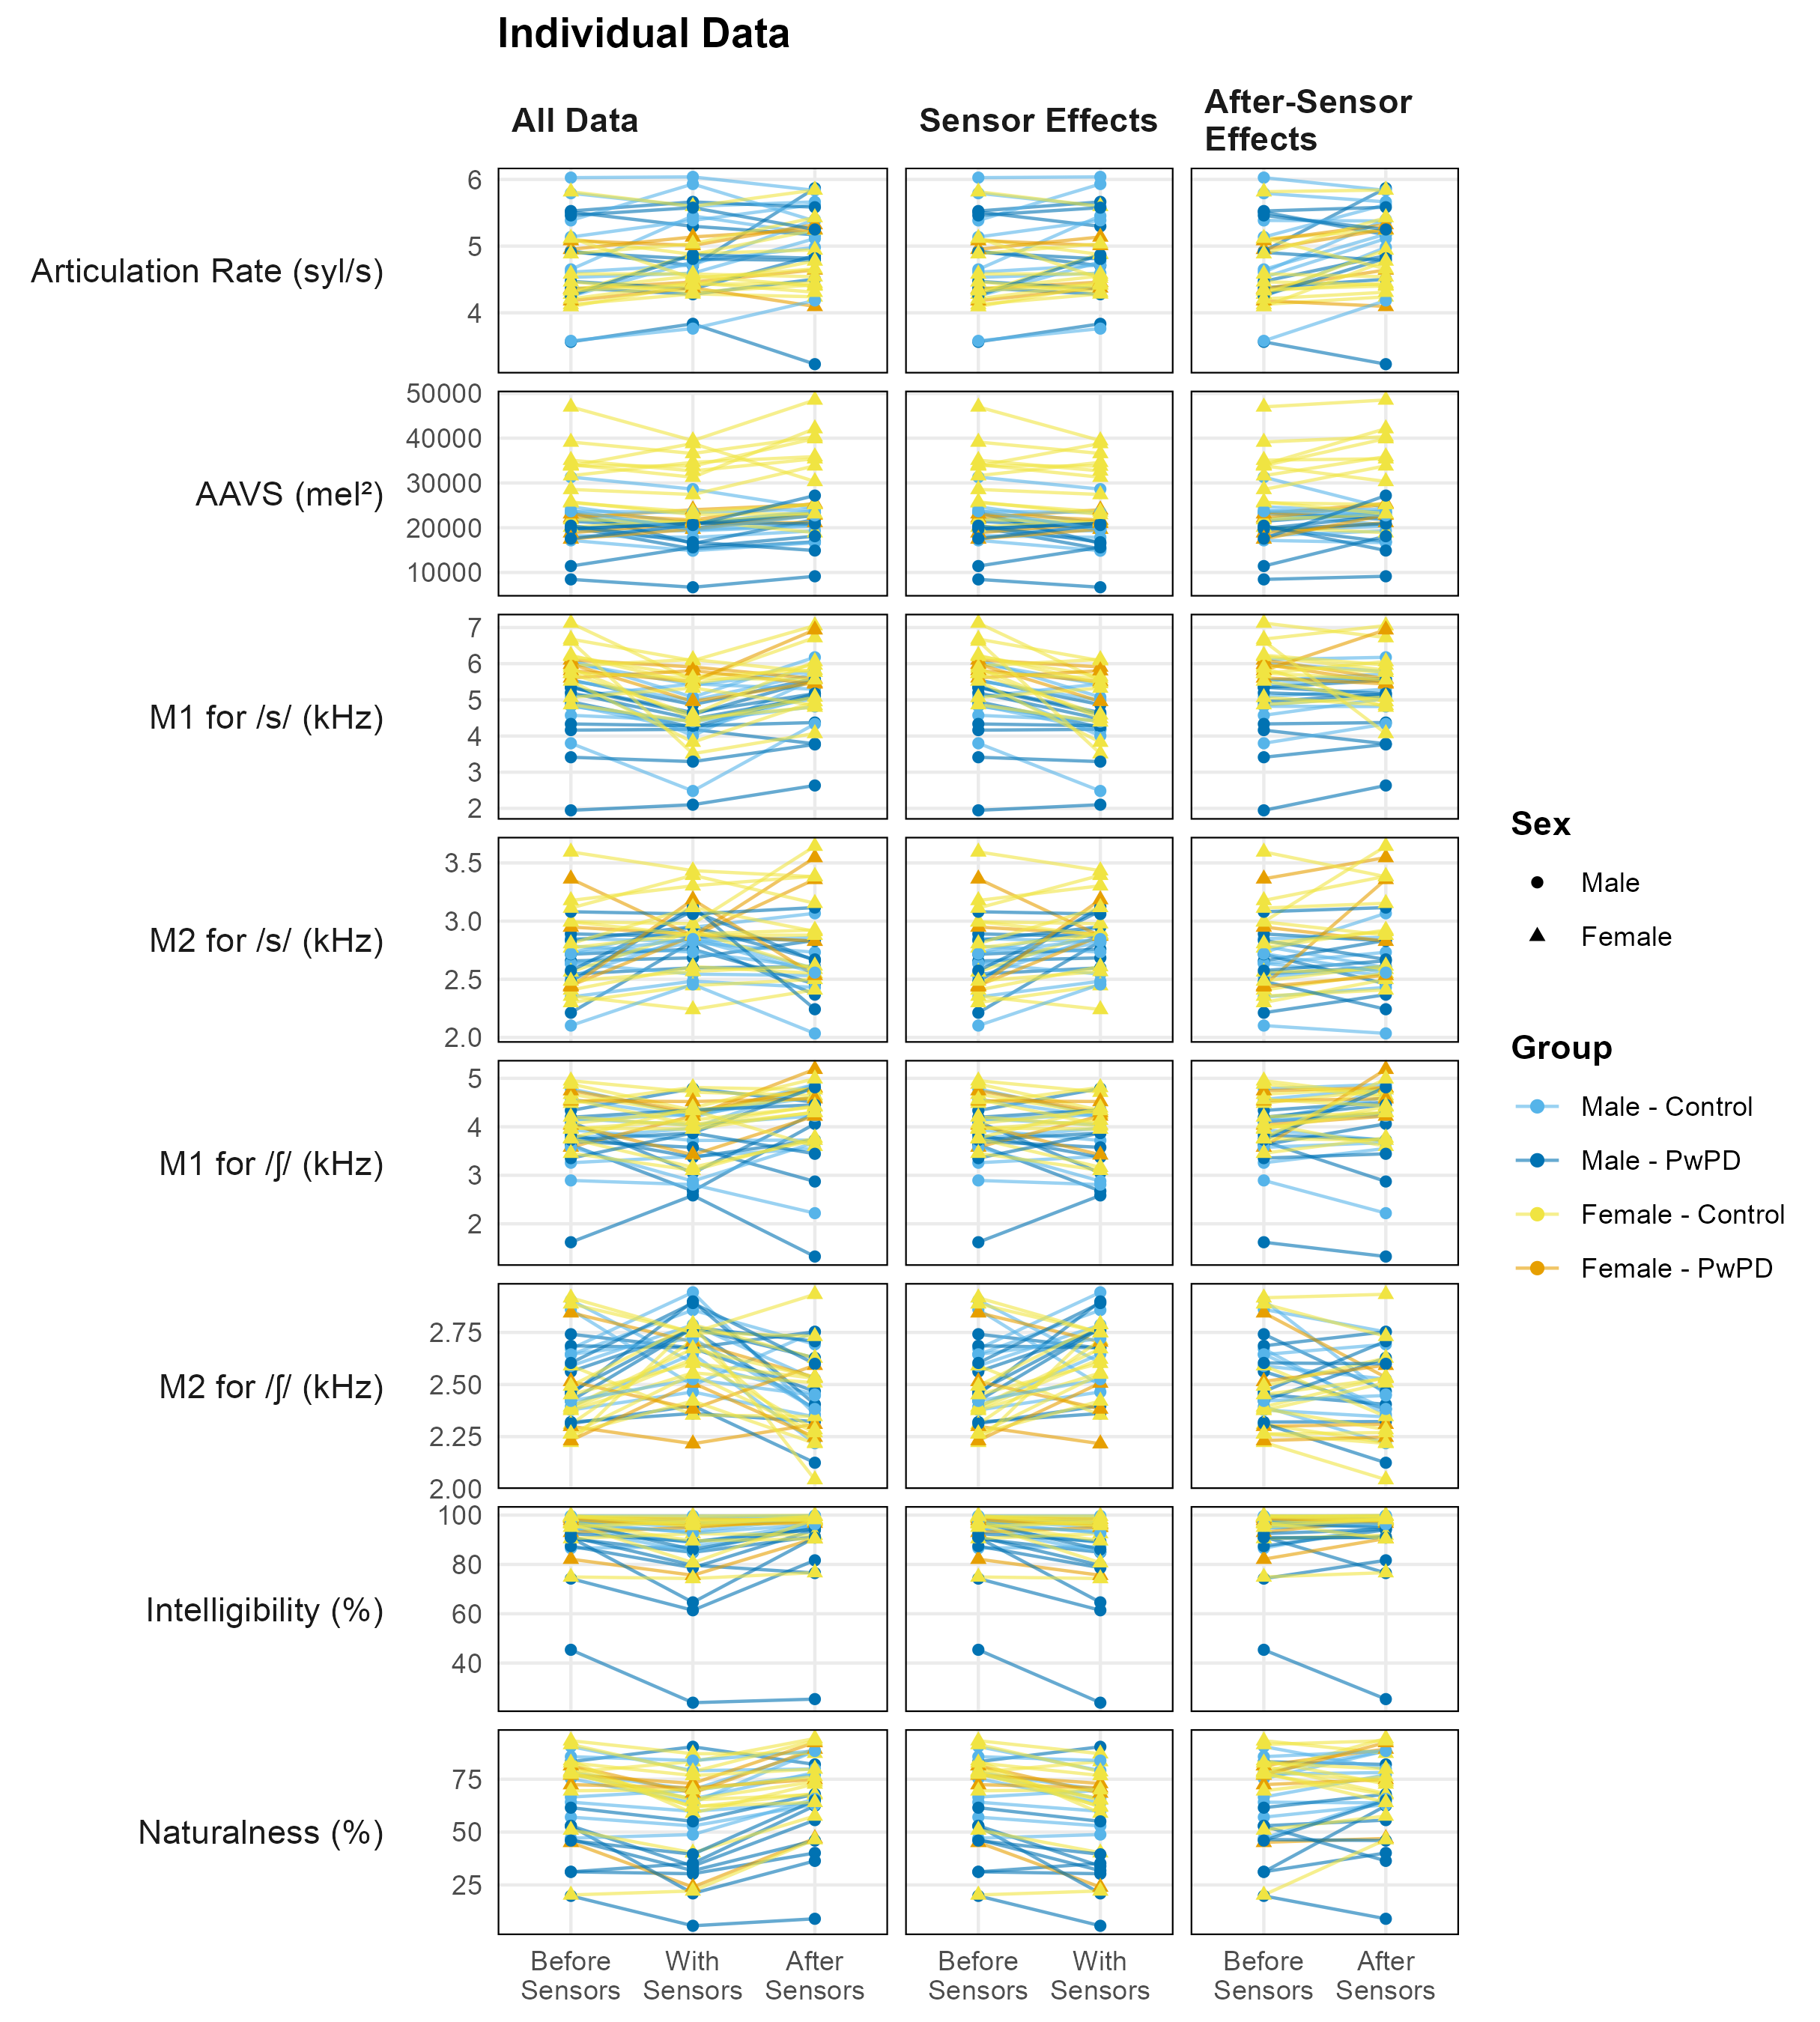
Note. The raw data for each participant across all three time points (left panel), between Before Sensors and With Sensors (middle panel), and between Before Sensors and After Sensors (right panel).
Tables
Table S1
| Group | Age | Time Since Diagnosis (years) | Severity1 | |
|---|---|---|---|---|
| Male Speakers | ||||
| PDM01 | PD | 60 | 15 | Profound |
| PDM02 | PD | 80 | 13 | Profound |
| PDM03 | PD | 50 | 7 | Mild |
| PDM04 | PD | 79 | 6 | Severe |
| PDM05 | PD | 65 | 6 | Moderate |
| PDM06 | PD | 82 | 10 | Moderate |
| PDM07 | PD | 78 | 3 | Severe |
| PDM08 | PD | 82 | 2 | Moderate |
| PDM09 | PD | 74 | 2 | Moderate |
| n | 9 | — | — | — |
| M | — | 72.22 | 7.11 | — |
| SD | — | 11.34 | 4.70 | — |
| Female Speakers | ||||
| PDF01 | PD | 80 | 4 | Mild |
| PDF02 | PD | 61 | 12 | Severe |
| PDF03 | PD | 63 | 3 | Moderate |
| PDF04 | PD | 69 | 3 | Mild |
| n | 4 | — | — | — |
| M | — | 68.25 | 5.50 | — |
| SD | — | 8.54 | 4.36 | — |
| N | 13 | — | — | — |
| Total M | — | 71.00 | 6.62 | — |
| Total SD | — | 10.38 | 4.48 | — |
| 1 Severity labels were previously determined by Thompson & Kim (2024) based on the intelligibility measures using the surrogate-severity measures outlined in Stipancic et al. (2022). Specifically, intelligibility values > 94% are `Normal`, 85% - 94% are `Mild`, 70% - 84% are `Moderate`, 45% - 69% are `Severe`, and < 45% are `Profound`. | ||||
Table S2
| Group | Age | |
|---|---|---|
| Male Speakers | ||
| CM01 | Control | 49 |
| CM02 | Control | 51 |
| CM03 | Control | 85 |
| CM04 | Control | 47 |
| CM05 | Control | 68 |
| CM06 | Control | 70 |
| CM07 | Control | 53 |
| CM08 | Control | 74 |
| CM09 | Control | 81 |
| n | 9 | — |
| M | — | 64.22 |
| SD | — | 14.52 |
| Female Speakers | ||
| CF01 | Control | 66 |
| CF02 | Control | 67 |
| CF03 | Control | 54 |
| CF04 | Control | 68 |
| CF05 | Control | 56 |
| CF06 | Control | 68 |
| CF07 | Control | 65 |
| CF08 | Control | 49 |
| CF09 | Control | 65 |
| CF10 | Control | 72 |
| CF11 | Control | 76 |
| CF12 | Control | 67 |
| n | 12 | — |
| M | — | 64.42 |
| SD | — | 7.69 |
| N | 21 | — |
| Total M | — | 64.33 |
| Total SD | — | 10.81 |
Table S3
| Characteristic | N = 791 |
|---|---|
| Age | 20.62 (0.96) |
| Gender | |
| Woman | 79 (100%) |
| Race | |
| Asian American | 3 (4%) |
| Biracial or Multiracial | 3 (4%) |
| Black/African American | 1 (1%) |
| Prefer not to say | 1 (1%) |
| White/Caucasian | 71 (90%) |
| Ethnicity | |
| Hispanic/Latino | 13 (16%) |
| Not Hispanic/Latino | 64 (81%) |
| Prefer not to say | 2 (3%) |
| 1 Mean (SD); n (%) | |
Table S4
| Predictors | Articulation Rate (syl/s) | AAVS (log of mel2) | ||||
|---|---|---|---|---|---|---|
| Estimates | pd | CI (95%) | Estimates | pd | CI (95%) | |
| Fixed Effects | ||||||
| Intercept (Control × Before Sensors) | 6.04 | 1.00 | 4.79 – 7.26 | 10.23 | 1.00 | 9.62 – 10.84 |
| PwPD | .04 | .57 | -.39 – .46 | -.28 | 1.00 | -.48 – -.09 |
| Female | -.33 | .95 | -.71 – .06 | .31 | 1.00 | .13 – .49 |
| Age | -.02 | .97 | -.04 – .001 | -.002 | .71 | -.01 – .01 |
| Control × With Sensors | .14 | .98 | .01 – .26 | -.06 | .96 | -.12 – .01 |
| PwPD × With Sensors | -.07 | .76 | -.27 – .13 | .03 | .74 | -.07 – .13 |
| Control × After Sensors | .24 | 1.00 | .12 – .37 | .01 | .63 | -.05 – .07 |
| PwPD × After Sensors | -.10 | .84 | -.31 – .10 | .09 | .96 | -.01 – .19 |
| Random Effects | ||||||
| σ2 | .126 | .103 | ||||
| NSpeakerID | 34 | 34 | ||||
| NSpeakerID/Phrase | 102 | |||||
| Summary | ||||||
| Observations | 305 | 102 | ||||
| Bayesian R2 | .798 | .905 | ||||
Table S5
| Predictors | M1 for /s/ (kHz) | M1 for /ʃ/ (kHz) | ||||
|---|---|---|---|---|---|---|
| Estimates | pd | CI (95%) | Estimates | pd | CI (95%) | |
| Fixed Effects | ||||||
| Intercept (Control × Before Sensors) | 7.05 | 1.00 | 5.37 – 8.63 | 4.84 | 1.00 | 3.49 – 6.19 |
| PwPD | -.30 | .83 | -.91 – .32 | -.06 | .60 | -.56 – .44 |
| Female | .80 | 1.00 | .30 – 1.32 | .45 | .98 | .03 – .88 |
| Age | -.03 | .99 | -.05 – -.004 | -.02 | .94 | -.04 – .004 |
| Control × With Sensors | -.80 | 1.00 | -1.07 – -.52 | -.15 | .89 | -.38 – .09 |
| PwPD × With Sensors | .43 | .97 | -.03 – .87 | .08 | .67 | -.29 – .47 |
| Control × After Sensors | -.16 | .87 | -.43 – .12 | .14 | .88 | -.09 – .36 |
| PwPD × After Sensors | .22 | .83 | -.23 – .66 | .08 | .67 | -.29 – .45 |
| Random Effects | ||||||
| σ2 | .206 | .144 | ||||
| NSpeakerID | 34 | 34 | ||||
| Summary | ||||||
| Observations | 102 | 103 | ||||
| Bayesian R2 | .798 | .722 | ||||
Table S6
| Predictors | M2 for /s/ (kHz) | M2 for /ʃ/ (kHz) | ||||
|---|---|---|---|---|---|---|
| Estimates | pd | CI (95%) | Estimates | pd | CI (95%) | |
| Fixed Effects | ||||||
| Intercept (Control × Before Sensors) | 2.69 | 1.00 | 2.04 – 3.35 | 2.52 | 1.00 | 2.16 – 2.89 |
| PwPD | .07 | .71 | -.18 – .31 | -.06 | .78 | -.21 – .09 |
| Female | .22 | .99 | .02 – .42 | -.09 | .93 | -.20 – .03 |
| Age | -.002 | .64 | -.01 – .01 | .001 | .62 | -.005 – .01 |
| Control × With Sensors | .11 | .97 | -.01 – .24 | .12 | .99 | .03 – .21 |
| PwPD × With Sensors | .08 | .81 | -.11 – .28 | -.002 | .52 | -.15 – .15 |
| Control × After Sensors | .07 | .88 | -.05 – .19 | -.08 | .96 | -.17 – .01 |
| PwPD × After Sensors | -.003 | .51 | -.20 – .19 | .05 | .75 | -.10 – .20 |
| Random Effects | ||||||
| σ2 | .039 | .022 | ||||
| NSpeakerID | 34 | 34 | ||||
| Summary | ||||||
| Observations | 102 | 103 | ||||
| Bayesian R2 | .664 | .540 | ||||
Table S7
| Predictors |
Intelligibility (logit scale)
|
Naturalness (logit scale)
|
||||
|---|---|---|---|---|---|---|
| Estimates | pd | CI (95%) | Estimates | pd | CI (95%) | |
| Fixed Effects | ||||||
| Intercept (Control × Before Sensors) | 4.71 | 1.00 | 2.94 – 6.48 | 3.16 | 1.00 | 1.14 – 5.11 |
| PwPD | -.27 | .81 | -.88 – .34 | -.61 | .96 | -1.32 – .08 |
| Female | .35 | .90 | -.22 – .91 | .32 | .85 | -.30 – .94 |
| Age | -.03 | .98 | -.05 – -.001 | -.03 | .99 | -.06 – -.004 |
| Control × With Sensors | -.22 | .99 | -.39 – -.04 | -.44 | 1.00 | -.62 – -.26 |
| PwPD × With Sensors | -.42 | 1.00 | -.70 – -.15 | .01 | .54 | -.29 – .32 |
| Control × After Sensors | .13 | .93 | -.04 – .30 | .08 | .81 | -.10 – .27 |
| PwPD × After Sensors | -.25 | .96 | -.51 – .02 | .21 | .91 | -.10 – .51 |
| Trial Number | -.01 | .97 | -.02 – .001 | -.01 | .99 | -.03 – -.002 |
| Random Effects | ||||||
| σ2 | -.371 | .221 | ||||
| NSpeakerID | 34 | 34 | ||||
| NSpeakerID/Passage | 102 | 102 | ||||
| NListenerID | 78 | 78 | ||||
| Summary | ||||||
| Observations | 1326 | 1326 | ||||
| Bayesian R2 | .605 | .543 | ||||
Footnotes
While the University of Wisconsin (UW) X-ray microbeam (XRMB) system is not an EMA system, this type of X-ray methodology was used prior to the widespread use of EMA (Barlow et al., 1983; Fujimura et al., 1973; Westbury, 1991). However, both methods allow for the investigation of fleshpoint data during speech movement. The XRMB used eight gold pellets attached to various articulators, including four lingual pellets. The pellets were 2-3 mm in diameter and did not require sensor wires like EMA devices.↩︎
Please note that the current study measured intelligibility using VAS, while Hustad et al. (2015) used orthographic transcriptions. However, the approach to describing reliability among perceptual ratings is consistent.↩︎